Telerik Reporting enables developers to embed rich, interactive reports directly into their .NET web and desktop applications without relying on external tools. This comprehensive reporting solution streamlines the process of designing, viewing, and exporting enterprise-grade documents, making it a favorite for teams building data-driven software on Windows 11 and Windows 10. By integrating a powerful reporting engine with intuitive report designers, it allows end-users to visualize complex data sets seamlessly within their existing workflows.
Key Features
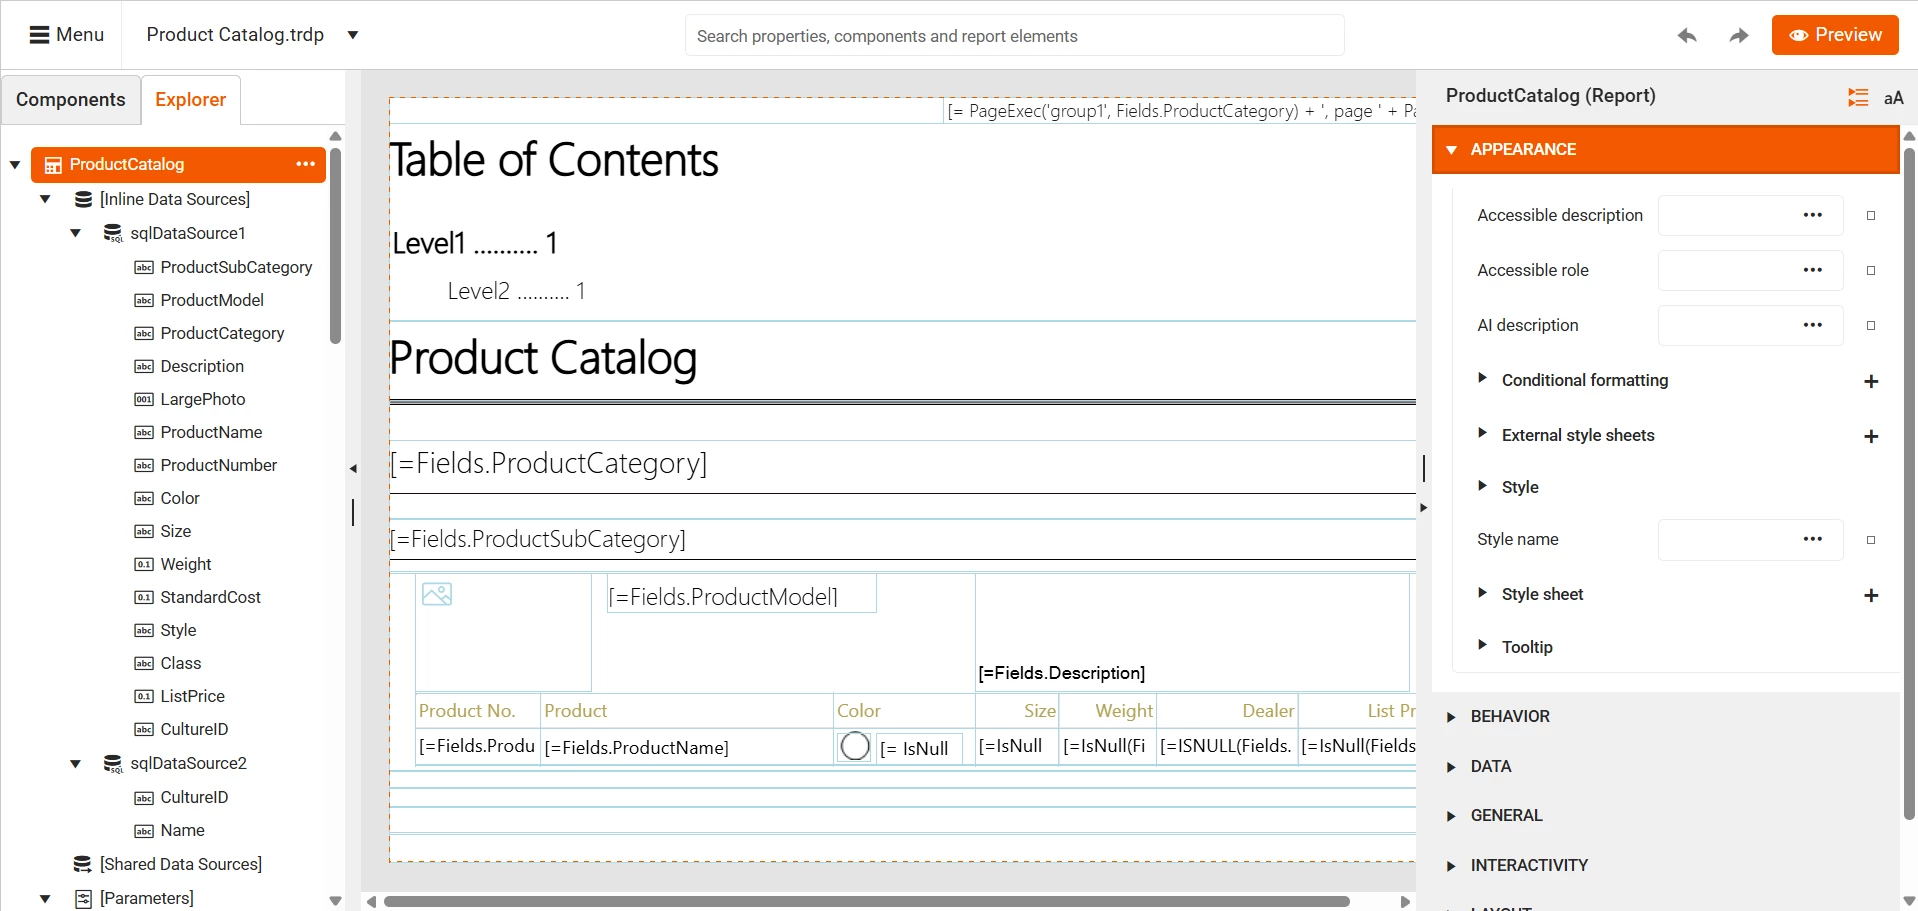
- Web Report Designer with Custom Templates: Empowers end-users to create and modify reports directly in their browser using predefined templates, ensuring brand consistency while reducing development backlog.
- AI Coding Assistant Integration: Accelerates implementation by using the Model Context Protocol (MCP) Server to help developers configure reporting components and generate code snippets for Blazor, Angular, and React wrappers.
- GraphQL Data Source Component: Connects natively to GraphQL APIs through a dedicated wizard, allowing precise data fetching and efficient handling of hierarchical structures without writing complex boilerplate code.
- .NET 10 & Cross-Platform Engine: Delivers day-zero support for the latest .NET frameworks (including .NET 9 and previews of .NET 10) while maintaining compatibility with .NET Framework 4.6.2+ for legacy Windows environments.
- User-Initiated Report Preview: Optimizes performance in Blazor and Angular viewers by allowing users to manually trigger report generation, preventing unnecessary load times for large data-intensive documents.
- Versatile Export Formats: Renders reports faithfully across 15+ formats including Excel, PDF, Word, and PowerPoint, preserving layout fidelity and interactive elements like drill-down actions.
Use Cases
This software is ideal for enterprise .NET developers who need to embed sophisticated analytics into line-of-business applications for finance, healthcare, or logistics sectors. It excels in scenarios where end-users require self-service reporting capabilities to generate invoices, inventory summaries, or compliance documents dynamically from live SQL or GraphQL databases.
Telerik Reporting stands out by offering a truly embeddable, royalty-free distribution model that gives developers complete control over the reporting experience unlike server-dependent alternatives.
Version 16.0.22.225 — May 2022
- Added official support for .NET 10 to the Reporting engine, REST Services, and Standalone Report Designer.
- Extended the AI Coding Assistant to support all major reporting components, including the Web Report Designer and desktop viewers.
- Introduced the ability to load and save custom report templates in the Web Report Designer.
- Updated the SkiaSharp dependency to version 3.119.1.
- Fixed an issue where password-protected PDF documents appeared blank when viewed on macOS.
- Resolved a compatibility exception in the Native Blazor Report Viewer when used with Telerik UI for Blazor 12.0.
- Corrected a misleading error message ("telerik_ReportViewer is not a function") displayed when the REST service is inaccessible.
- Fixed a bug in the HTML5 Report Viewer where
getReportParameters()would fail if a parameter allowing nulls had a null default value. - Addressed an issue where error messages in the HTML5 Viewer were displayed with incorrect coloring during report loading.