Argus Monitor operates as a precision instrument for hardware management, specifically designed to bridge the gap between noisy, unoptimized cooling and silent system efficiency. Unlike basic motherboard BIOS settings that typically restrict case fan speeds to processor temperatures, this software functions as a centralized command center that reads thermal data from across the entire system. PC builders, overclockers, and enthusiasts rely on it to link intake and exhaust fan behavior directly to the hottest components, ensuring that heavy gaming loads or rendering tasks trigger the correct cooling response without unnecessary noise. Proper thermal management dictates that a computer should only generate acoustic noise when physical heat dissipation strictly demands it, and achieving that balance requires software that understands the entire hardware ecosystem.
The primary reason users seek out a dedicated desktop application for thermal management is the limitation of default hardware controls. Modern graphics cards can draw massive amounts of electrical power and dump excess heat directly into the chassis, yet standard BIOS fan curves often ignore graphics processor temperatures entirely. By tapping directly into the SuperIO monitoring chips integrated on the motherboard, this utility reads the exact thermal output of the main processor, graphics card, liquid cooling loops, and storage drives. Administrators can then instruct their front intake fans to respond to the graphics card rather than the processor, keeping ambient case temperatures low exactly when a heavy graphics workload heats up the system.
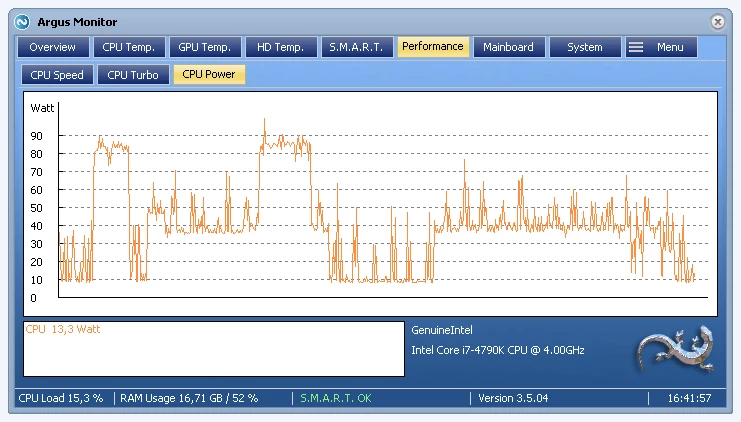
Because the software interacts directly with low-level motherboard sensors and embedded controllers, it requires a native Windows environment rather than a lightweight browser extension or web-based dashboard. This deep hardware access allows it to govern multi-controller configurations, ensuring that fans ramp up and down smoothly based on mathematical averages rather than sudden, erratic temperature spikes. The resulting workflow provides complete authority over acoustic profiles and hardware health, turning a loud desktop computer into an optimized workstation. Rather than guessing at fan speeds through trial and error in a pre-boot environment, administrators gain real-time visibility into the exact RPM values and thermal limits while the operating system is under an active, real-world load.
Key Features
- Advanced Fan Control Curves: Users can abandon static cooling profiles and map fan behavior to graphical curves based on specific temperature thresholds. The interface allows manual plotting of speed percentages against thermal readouts from the processor, graphics card, VRMs, or storage drives. This ensures case fans remain entirely quiet during idle desktop tasks like text editing, and scale up predictably as hardware heat increases during heavy 3D rendering.
- Multi-Source Temperature Averaging: Instead of relying on a single heat source, the software can evaluate multiple sensors simultaneously using mathematical operations. Administrators can configure a chassis fan to monitor both the processor and the graphics card, instructing the fan to follow whichever component is currently reporting the highest temperature. This guarantees optimal airflow regardless of which specific hardware part is under heavy load.
- Hysteresis and Rate Limiting: Sudden temperature spikes, such as opening a web browser or launching an application, often cause fans to spin up loudly for a split second before slowing down. The application prevents this erratic behavior by applying time-based averaging and step-up limits. By forcing the controller to evaluate temperatures over a rolling multi-second window, the acoustic profile remains steady and ignores momentary thermal jumps.
- Storage Health and S.M.A.R.T. Monitoring: Beyond fan management, the utility continuously tracks the physical condition of mechanical hard drives and solid-state drives. It reads S.M.A.R.T. attributes in the background, measuring metrics like read errors, allocated sectors, and NAND wear levels. Administrators receive early graphical warnings if a mechanical drive approaches critical failure thresholds, providing ample time to secure data backups before a total hardware loss occurs.
- Hardware RGB Synchronization: The application centralizes lighting control for supported hardware ecosystems, including specific devices from Corsair, Asus, and NZXT. Instead of purely aesthetic color cycles, users can map LED colors directly to component temperatures. A liquid cooling pump or a strip of case lights can shift from blue to red as the processor heats up, providing a visual indicator of thermal load without opening a monitoring window.
- Taskbar and Tray Icon Displays: Keeping a large graphical interface open consumes desktop space, so the software routes critical data directly to the Windows notification area. Users can configure custom tray icons that display real-time digits for processor heat, fan RPM, or storage utilization. This keeps essential hardware metrics visible at a glance while the main engine runs quietly in the background.
How to Install Argus Monitor on Windows
- Download the official Windows installer executable directly from the developer to ensure you receive the unmodified application files and legitimate sensor drivers.
- Launch the downloaded setup file and grant administrator privileges when prompted by the Windows User Account Control dialogue, as administrator access is mandatory to place kernel-level drivers into the operating system for motherboard communication.
- Review and accept the end-user license agreement, then specify the local directory path where the application folder should reside on your primary storage drive.
- Select the installation options for desktop shortcuts and decide whether the application should launch automatically when Windows starts. Enabling the startup option is strongly recommended so your custom fan curves engage immediately upon booting up.
- Click through the final confirmation screen to extract the files and finish the installation sequence, then reboot the computer if the setup wizard requests it to initialize the low-level hardware drivers.
- Occasionally, aggressive Windows Defender settings or Core Isolation features might flag the low-level sensor drivers; ensure that Memory Integrity settings allow the driver to load if the software fails to read processor speeds upon the initial launch.
- Open the program for the first time and navigate to the main settings panel to select your specific network or embedded controller chip, such as Nuvoton or ITE, ensuring the software pulls data from the correct physical sensors.
Argus Monitor Free vs. Paid
The application operates on a commercial licensing model but provides a fully functional 30-day trial for new users. During this evaluation period, all hardware sensors, fan curve tools, and multi-controller logic are unlocked. This allows administrators to verify that the software correctly interfaces with their specific motherboard and graphics card sensors before committing to a purchase.
Once the trial concludes, continuing to use the software requires acquiring a license key, typically offered in one-year or three-year tiers. The one-year license costs approximately $16, while the three-year option sits around $36, though regional currency differences apply. A single license legally covers two concurrent computer installations, accommodating users who want to manage both a primary workstation and a secondary gaming setup simultaneously without buying the product twice.
The pricing structure utilizes a perpetual fallback mechanism rather than a strict ongoing subscription. When a one-year or three-year license expires, the user retains the right to indefinitely use any version of the software released prior to that expiration date. Paying for a renewal is only necessary to unlock updates, bug fixes, or compatibility improvements for newly released computer hardware architectures.
Argus Monitor vs. Fan Control vs. HWiNFO
Fan Control is an open-source alternative that focuses entirely on cooling management using a highly visual, node-based interface. It allows users to mix and match temperature sources and curves by dragging and dropping elements on the screen, and it costs nothing to use. However, Fan Control strictly manages fans and lacks the broader hardware diagnostic tools, storage health tracking, and RGB synchronization found in commercial alternatives.
HWiNFO excels as an exhaustive diagnostic utility, capable of reading thousands of individual data points across the motherboard, processor, and peripherals. It is the industry standard for logging voltages, memory timings, and wattage. While it does include a legacy fan management module, the interface is purely data-driven, lacking the smooth graphical curve editors, hysteresis controls, and intuitive multi-source averaging required for modern acoustic tuning.
Argus Monitor acts as the middle ground for users who need both deep hardware insights and sophisticated cooling management in a single interface. It provides the visual fan curves and multi-source logic necessary to quiet a noisy gaming rig, while also handling hard drive health alerts and tray icon data. Administrators who want commercial stability, perpetual licensing, and built-in S.M.A.R.T. monitoring typically choose it over running multiple separate utilities.
Common Issues and Fixes
- Anti-cheat software blocking temperature readings. Games utilizing strict kernel-level anti-cheat engines, such as BattleEye, sometimes block the Asus embedded controller service because it flags hardware polling as suspicious behavior. To resolve this, disable the Asus EC monitoring option in the software settings and rely strictly on the primary SuperIO chip for temperature data, or simply restart the monitoring tool after the game launches.
- Case fans spinning to maximum speed during a system reboot. When the operating system shuts down and kills background tasks, the software occasionally leaves the fan headers in an undefined state, causing them to ramp up to 100 percent until the next boot completes. Fix this behavior by entering the motherboard BIOS and manually changing the fan header configuration from "Auto" to explicitly "PWM" or "DC" mode.
- Fans refusing to stop at zero percent. Assigning a custom curve to drop to zero percent often results in the fan continuing to spin at a low audible hum. Most four-pin PWM fans are physically manufactured with a minimum speed floor of 25 to 30 percent. To achieve a true zero RPM state, ensure your motherboard supports cutting voltage completely to the header, or verify that your specific fan model advertises a zero-RPM feature.
- Duplicate sensor names cluttering the interface. Motherboards running vendor-specific background utilities often report the same hardware temperature twice under slightly different names. Open the software configuration panel and hide the duplicate channels labeled "Asus Service," keeping only the direct hardware readings from the Nuvoton or ITE monitoring chip to streamline the interface.
Version 7.3.03 — December 2025
- Added support for Corsair iCUE Link hardware devices.
- Fixed an application crash that occurred when applying RGB effects while the system resumed from standby or hibernation.
- Implemented various other bug fixes and performance optimizations.