Geekbench operates as a highly specialized benchmarking utility designed to measure and quantify the underlying performance capabilities of computer hardware. Instead of simply listing clock speeds, cache sizes, or theoretical core counts, this tool actively tests processors and graphics cards by running them through a strict series of practical, heavily simulated computing tasks. Hardware reviewers, system builders, and technical enthusiasts rely on the application to establish a baseline for how a specific machine handles everyday demands. By pushing the hardware through a gauntlet of structured workloads, the software provides a standardized score that can be instantly compared against a massive global database of other computers. This objective numerical output strips away marketing claims, giving users a clear view of how their silicon actually performs.
Running a local desktop application rather than relying on a browser-based test is necessary for accurate and unhindered hardware evaluation. Web browsers introduce severe performance overhead, prioritize security sandboxing, and restrict direct access to low-level hardware APIs, which makes it impossible to accurately measure raw compute capacity. By operating as a standalone Windows executable, the utility bypasses these software limitations to push the processor and graphics hardware directly. This localized execution allows the software to measure exact response times and processing speeds across varying thermal conditions, providing granular data that browser-based alternatives simply cannot capture.
Users turn to this specific utility when diagnosing hardware bottlenecks, verifying whether a newly built computer performs as advertised, or checking if thermal throttling is occurring under heavy load. Rather than focusing entirely on abstract mathematical calculations that rarely occur in normal desktop use, the software structures its workloads around practical, daily jobs. It runs scripts, processes text, compiles code, and applies complex visual effects to images, ensuring that the resulting numbers actually correlate with the responsiveness a user will experience when working in productivity applications or multimedia editors. This focus on real-world simulation ensures the benchmark remains relevant to actual computing needs.
Key Features
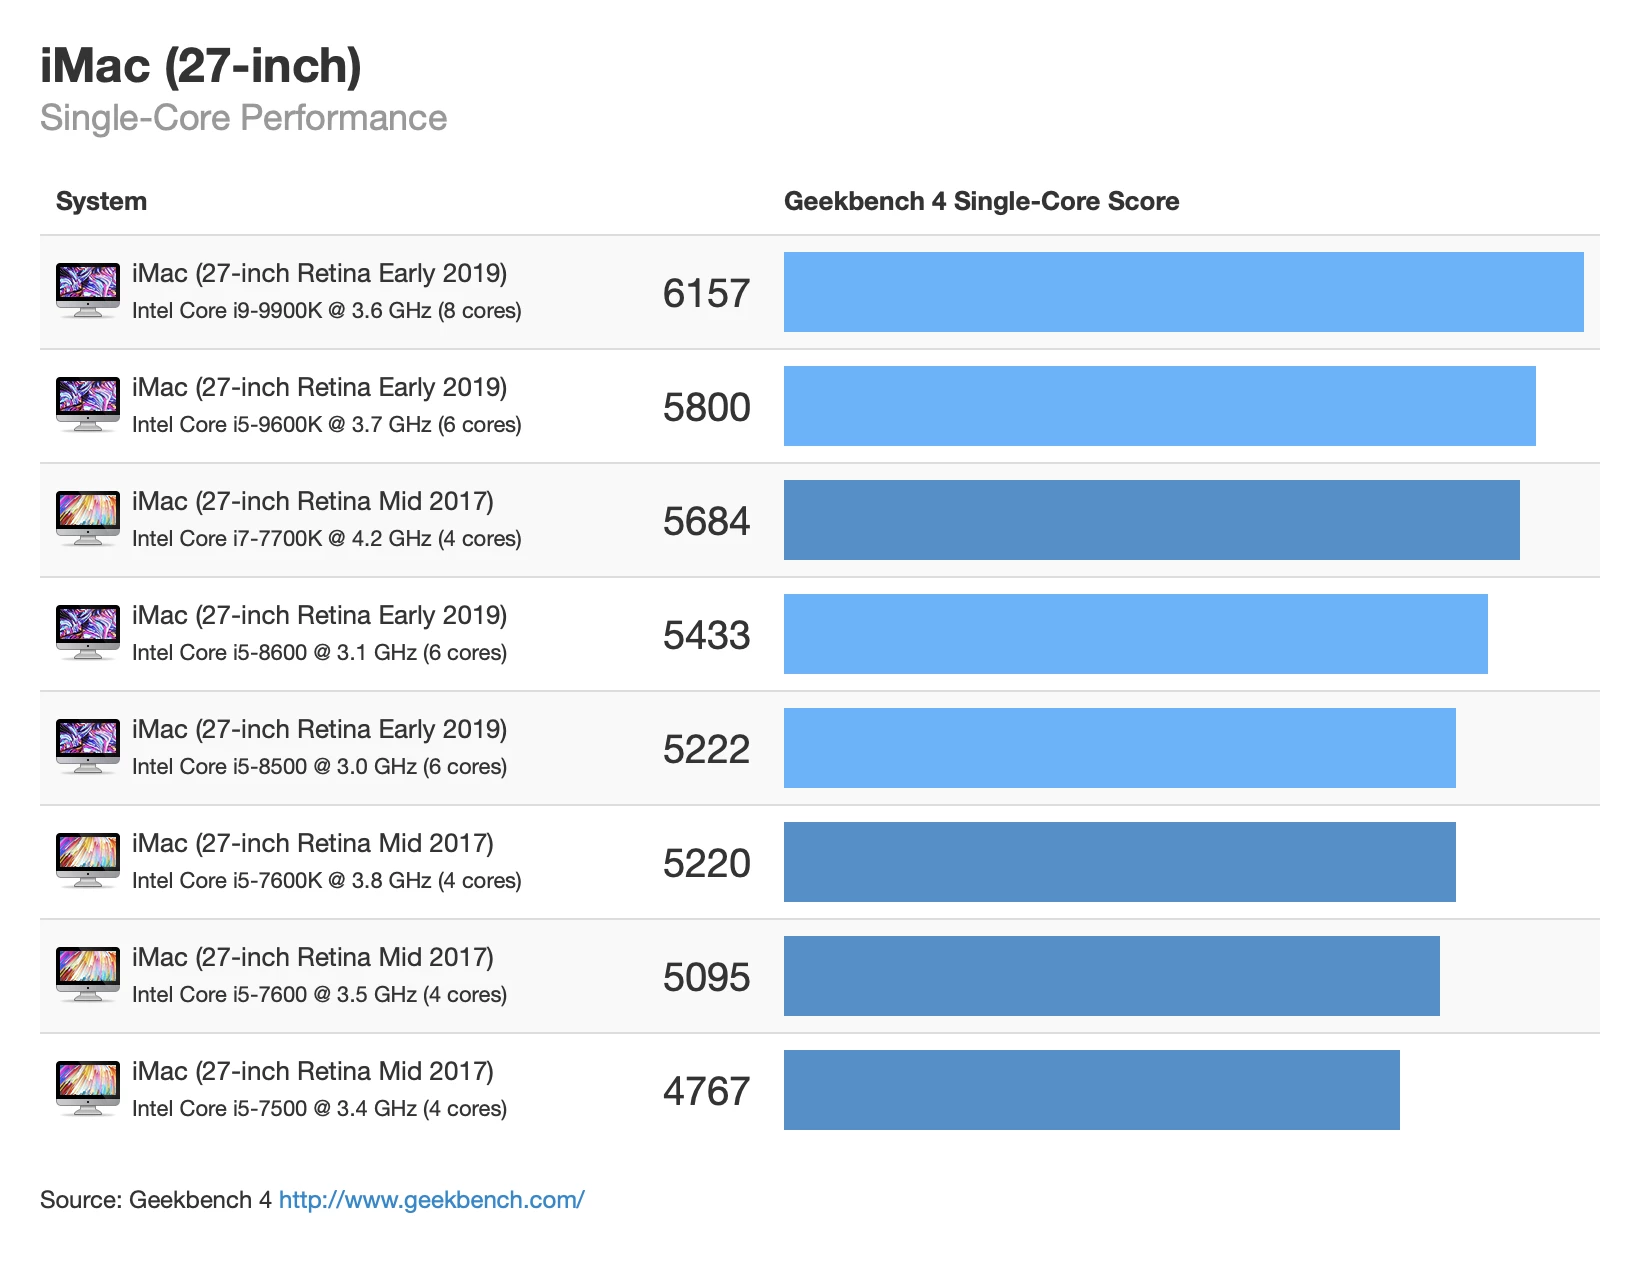
- Single-Core and Multi-Core Testing: The software separates processor evaluation into distinct single-thread and multi-thread categories to reflect different software behaviors. Single-core tests determine how fast the hardware handles lightly threaded tasks like basic web rendering, audio playback, and text processing. The multi-core tests utilize a shared-task model to simulate heavy workloads like code compilation and file compression, distributing the effort across all available processing cores to measure the total architectural capacity of the system.
- GPU Compute Benchmarking: Beyond the main processor, the utility rigorously evaluates the computational strength of the graphics card using industry-standard OpenCL and Vulkan APIs. This specific testing module does not measure frame rates in 3D gaming; instead, it measures how well the graphics hardware handles heavy computational tasks. This includes executing particle physics simulations, performing edge detection in photographs, and applying complex visual filters to high-resolution images.
- Real-World Task Simulation: The core testing methodology avoids theoretical mathematics in favor of practical computing scenarios that reflect actual desktop usage. The workloads involve opening massive document files, compressing and decompressing large data archives using standard formats, navigating heavy web pages, and executing standard developer scripts. By mimicking these exact actions, the benchmark provides data that directly reflects daily desktop responsiveness rather than artificial peak outputs.
- Machine Learning Workloads: To account for modern software demands, the application includes dedicated artificial intelligence testing modules that target dedicated neural processing hardware. These tasks measure how quickly the hardware can execute local machine learning models, specifically focusing on object detection in photographs and real-time background blurring algorithms identical to those used by major video conferencing applications.
- Automated Results Database: After completing a testing run, the application automatically uploads the final performance metrics to the public Geekbench Browser database. This online repository categorizes the results by hardware components, allowing users to instantly compare their specific setup against baseline standards, competing processor models, or identical machines to determine if their specific system is underperforming due to thermal issues or driver configurations.
- Cross-Platform Baseline Comparison: The underlying testing algorithms are strictly standardized to run identically across entirely different hardware architectures and form factors. This unified testing approach allows users to directly compare the processing capabilities of a heavy desktop computer against portable hardware or rival architecture designs. It provides a clear numerical contrast without worrying about software optimization differences, establishing a universal standard for raw computing metrics.
How to Install Geekbench on Windows
- Open your web browser and navigate to the official vendor download page to secure the appropriate Windows installer package for the utility.
- Locate the downloaded executable file in your local downloads directory and double-click it to trigger the setup wizard, granting standard Windows User Account Control permissions if prompted.
- Review and accept the end-user license agreement presented by the installer to proceed with the local file configuration.
- Select the specific destination folder for the application files, which defaults to the standard Program Files directory on the primary Windows system drive, though it can be redirected to a secondary storage drive if necessary.
- Choose whether to create a desktop shortcut or a Start Menu folder for easier application access once the primary installation sequence completes.
- Click the final install button and allow the setup wizard to extract the necessary workload libraries, graphics API modules, and core executables directly to the local disk.
- Finish the setup process and launch the application directly from the prompt or by using the newly created Windows shortcut.
- Upon the first launch, users on the free tier can immediately click the run button to begin processor testing, while users with a paid license can navigate to the preferences menu to enter their registration details and unlock offline execution modes.
Geekbench Free vs. Paid
The software operates on a freemium pricing model, offering a fully functional free tier specifically designated for non-commercial users. The free version includes complete access to both the CPU and GPU compute benchmarks, allowing anyone to stress-test their hardware without entering payment details or creating a permanent user account. However, this free tier enforces a strict online requirement at the conclusion of every test. It mandates that all benchmark results be uploaded to the public Geekbench Browser via an active internet connection to be viewed, meaning users cannot keep their scores private, save them locally, or run the application on machines disconnected from the network.
For professionals, hardware reviewers, and corporate users operating in restricted environments, the developer offers a Pro tier, which requires a paid license priced at $99 per user. Purchasing the Pro version fundamentally changes the software's behavior by removing the mandatory upload requirement, allowing users to run tests and view their results entirely offline. This offline capability is critical for reviewers testing unreleased hardware under non-disclosure agreements, or IT professionals working on secure, air-gapped systems that lack external internet access.
In addition to offline results management, the Pro tier unlocks advanced workflow features tailored for technical environments. It provides command-line automation tools, enabling system administrators to script automated benchmark runs across multiple machines without ever interacting with the graphical user interface. The paid license also includes a standalone portable mode, allowing the entire application to be executed directly from a USB flash drive or local network location without needing to be formally installed on the target Windows machine. For enterprise deployments, the developer also offers custom Corporate Licenses, including Site and Source licenses, which provide broader usage rights for large organizations.
Geekbench vs. Cinebench vs. PCMark 10
Cinebench focuses exclusively on evaluating processor performance under maximum, sustained thermal load by rendering a highly complex 3D scene using a specialized rendering engine. Unlike tests that simulate brief bursts of daily activity, Cinebench forces the processor to run at maximum capacity for an extended, continuous period. This specific approach makes it an excellent tool for testing the efficiency of custom cooling solutions, checking for thermal throttling under heavy stress, and evaluating machines strictly intended for heavy 3D rendering. However, it does not measure system memory bandwidth, storage speed, or everyday web browsing responsiveness, making it a very narrow evaluation tool.
PCMark 10 takes a completely different approach by measuring holistic system performance through actual application traces rather than raw hardware isolation. Instead of targeting the processor or graphics card with synthetic workloads, it actually opens spreadsheet applications, runs video conferencing simulations, and tests application startup times to evaluate the entire computer as a single, cohesive unit. This makes it highly useful for enterprise buyers trying to determine baseline office productivity or laptop battery life during a standard workday, but it is much less useful for comparing the specific architectural differences between individual hardware components.
Geekbench serves as the better fit when a user needs a fast, highly standardized metric to isolate and compare raw processor and compute capability across entirely different device categories. Because its tests run in just a few minutes and strictly isolate specific computing concepts like machine learning, file compression, and basic physics calculations, it provides a highly legible number that easily demonstrates hardware generation improvements. It actively removes the variables of slow storage drives and prolonged thermal soaking, offering a clean, direct look at the architectural strength and computational efficiency of the processing hardware itself.
Common Issues and Fixes
- Problem description: Benchmark scores are unexpectedly low compared to identical hardware. Ensure the computer is set to a high-performance power plan within the Windows control panel and plugged directly into a wall outlet, as battery-saving modes severely throttle processor speeds to conserve energy. Additionally, close all background applications, monitoring overlays, and system tray processes, as these consume vital system resources and artificially lower the final benchmark score.
- Problem description: The application fails to display the final score after a test completes. Check your local network connection and verify your firewall rules. The free version of the software strictly requires active internet access to finalize the test and upload the metrics to the public database; if the outbound connection is blocked by security software, the results window will simply fail to populate.
- Problem description: The GPU Compute test crashes immediately upon launch. Update your graphics drivers to the latest available version provided directly by your hardware manufacturer. The compute benchmark relies heavily on specific OpenCL and Vulkan API instructions, and outdated, corrupted, or generic display drivers often lack the necessary libraries to execute these advanced rendering commands.
- Problem description: Multi-core scaling appears inefficient on massive enterprise processors. The utility uses a shared-task model designed to mimic how standard desktop applications distribute threads, rather than relying on perfectly parallel server behavior. For massive, high-core-count enterprise hardware, this desktop-focused threading model will not scale linearly, meaning specialized server benchmarking utilities should be used to test those specific workstation environments.
- Problem description: Hardware temperatures drop suddenly between individual workloads. This is expected behavior. The software deliberately inserts brief pauses between each individual workload to minimize the effect thermal issues have on the final score. These gaps allow the cooling system to catch up, ensuring that workloads appearing later in the benchmark are not unfairly penalized by accumulated heat from earlier tests.
Version 6.5.0 — September 2025
- Introduced support for Arm Scalable Matrix Extensions (SME) on Windows on ARM to enhance compatibility with future processors.
- Improved stability on mobile platforms by resolving a crash that occurred when viewing benchmark results on Android and iOS.
- Optimized hardware detection and performance measurement for upcoming Windows on ARM devices.