The Intel Processor Diagnostic Tool (IPDT) serves as the official method for verifying the health, authenticity, and stability of Intel-based microprocessors. Unlike third-party benchmarking utilities that focus solely on performance scores, this specialized software communicates directly with the CPU's firmware to confirm it operates within factory specifications. For users troubleshooting Blue Screen of Death (BSOD) errors or validating a second-hand hardware purchase, this utility provides a definitive answer regarding the physical integrity of the silicon.
Key Features
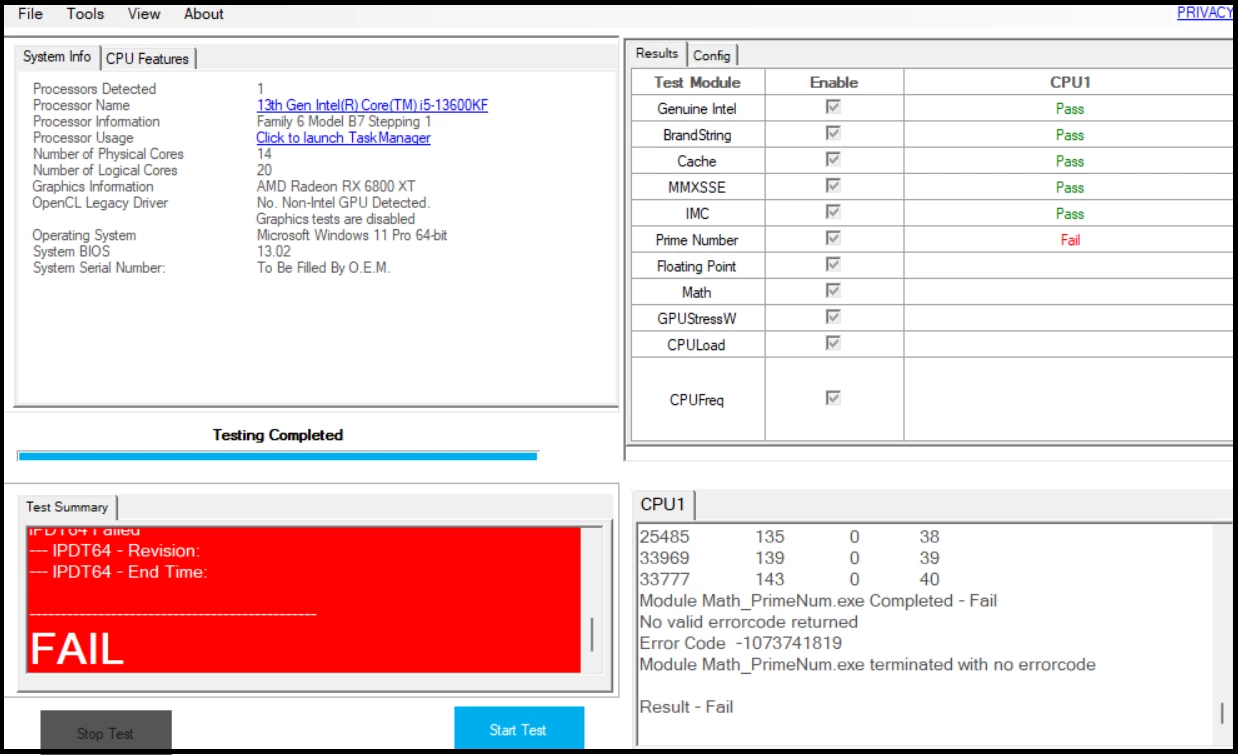
- Brand String Verification: Automatically reads the processor's internal identification data to detect re-marked or counterfeit chips, ensuring the installed hardware matches the package label.
- Integrated Memory Controller (IMC) Test: Validates the communication link between the CPU and system RAM, quickly identifying stability issues that are often mistaken for faulty memory sticks.
- Math & Floating Point Stress Tests: Executes complex calculations, including prime number generation, to push the arithmetic logic units (ALUs) to their limits and expose calculation errors under load.
- Temperature Monitoring: Tracks thermal performance in real-time during diagnostic routines, helping users identify overheating problems caused by poor cooler seating or dried thermal paste.
- Platform Confidence Check: Scans specific processor features and instruction sets (like AVX or SSE) to confirm they are enabled and functioning correctly within the Windows environment.
- Automatic Update Verification: The tool, specifically version 4.1.9.41, connects to Intel servers to ensure the diagnostic libraries are current, maintaining compatibility with modern architectures like 14th Gen processors.
Use Cases
System builders and PC enthusiasts rely on this utility immediately after assembling a new machine to confirm that the CPU was not damaged during installation. It is also an essential resource for IT technicians diagnosing random system freezes, as it allows them to rule out the processor as the root cause before replacing other components like the motherboard or power supply.
Choosing the Intel Processor Diagnostic Tool over generic alternatives guarantees that the test parameters align exactly with the manufacturer's engineering standards for Windows 10 and Windows 11 systems.
Version 4.1.9.41 — January 2024
- Added official support for 14th Generation Intel® Core™ processors.
- Implemented a run-time check to block execution on unsupported third-party processors.
- Updated all diagnostic modules to improve functionality and resolve bugs.
- Included various functional enhancements and security updates.