SolarWinds Network Performance Monitor (NPM) 2025.4.1 stands as a specialized tool for network administrators who need granular visibility into their infrastructure's health. This software monitors, detects, and analyzes network performance issues across hybrid environments, allowing IT professionals to spot outages or latency before they impact end users. By offering deep packet inspection and hop-by-hop analysis, the application simplifies the complex task of maintaining uptime for business-critical services.
Key Features
- NetPath Analysis: Visualizes the entire traffic path from source to destination, helping users pinpoint exactly where latency or packet loss occurs, even across carrier networks outside their direct control.
- PerfStack Dashboards: Allows administrators to drag and drop different metric types—such as network data, system performance, and storage metrics—onto a single timeline to correlate events and identify root causes instantly.
- Network Insight: Provides comprehensive monitoring for complex devices like Cisco ASA firewalls, F5 BIG-IP load balancers, and Palo Alto Networks firewalls, automating the retrieval of specific health data that standard SNMP polling might miss.
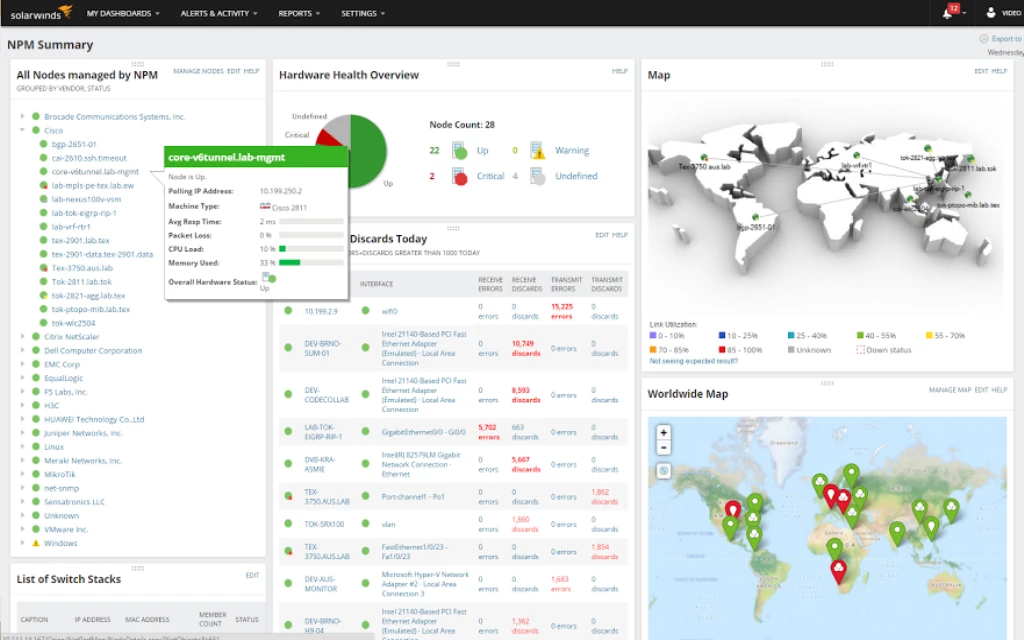
- Intelligent Maps: Automatically aggregates and draws up-to-date network topology maps, showing relationships between routers, switches, and interfaces without requiring manual updates from the IT team.
- Advanced Alerting: Reduces notification fatigue by allowing users to configure nested trigger conditions, ensuring that alerts are only sent for genuine issues rather than momentary glitches.
- WinRM Polling Support: Introduces modern polling capabilities for nodes running Windows 10 and Windows 11, providing a more secure and efficient alternative to traditional SNMP/WMI methods.
Use Cases
Network engineers and system administrators rely on this software to troubleshoot slow applications by determining if the fault lies with the network or the server. It is particularly effective in large corporate environments where tracking intermittent connectivity issues across hundreds of devices manually would be impossible.
SolarWinds NPM distinguishes itself by offering enterprise-grade monitoring capabilities with a deployment process that is surprisingly approachable for smaller IT teams.
Version 2025.4.1 — December 2025
Added:
- Enhanced host header validation for improved security
- Cloud infrastructure discovery and management from Settings menu
Improved:
- Security hardening to prevent Host header injection attacks
Fixed:
- Various platform-level security and stability fixes
Security:
- Host header validation to block unauthorized access attempts