Managing a network infrastructure across multiple locations, data centers, and cloud environments requires exact visibility into every hop and device. SolarWinds Network Performance Monitor (NPM) serves as the primary diagnostic and polling engine for IT teams tracking availability, bandwidth utilization, and fault data. Instead of relying on fragmented command-line utilities or isolated dashboard widgets, administrators deploy this central console to continuously poll switches, routers, firewalls, and servers. By standardizing the collection of hardware metrics, teams establish a clear baseline of normal traffic behavior and immediately detect irregular spikes or packet drops.
The desktop and server-hosted nature of this software is deliberate. NPM is an on-premises or customer-hosted application that relies heavily on a local SQL Server database and Windows services. Hosting the monitoring engine within the organization's own infrastructure keeps localized traffic data, simple network management protocol (SNMP) strings, and Windows Management Instrumentation (WMI) credentials securely behind the corporate firewall. It also guarantees that high-frequency polling data does not saturate the outward-facing internet connection just to update a third-party cloud dashboard. Network teams retain total ownership of their historical performance data, which is critical for compliance audits and long-term capacity planning.
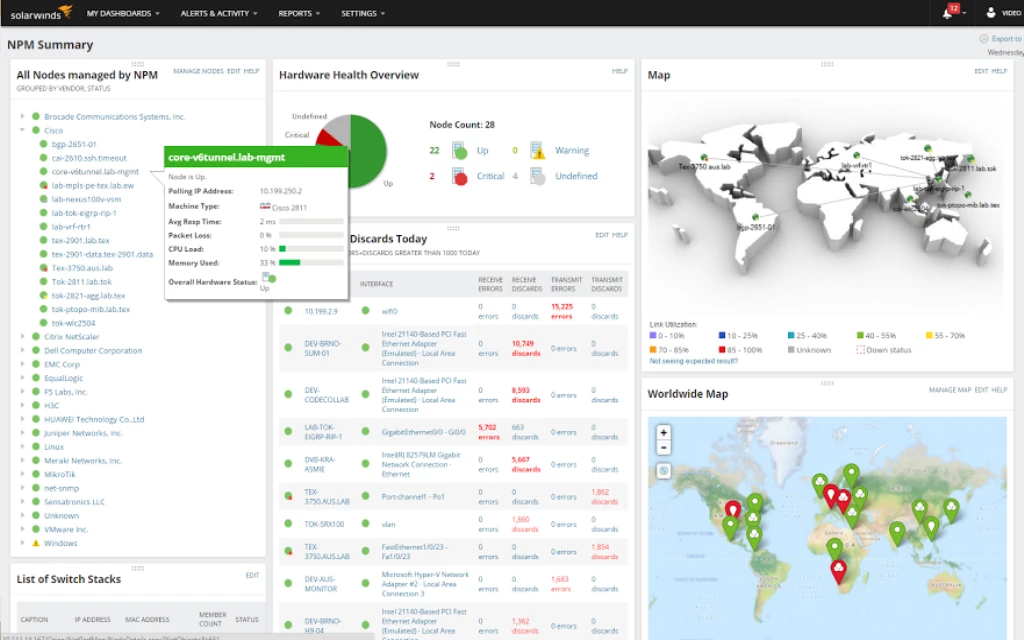
In daily operations, engineers use the tool to isolate latency spikes, track down unauthorized connected devices, map out failing load balancers, and prove whether an outage is a network routing issue or an application crash. By automating device discovery and mapping, the software replaces static network diagrams with live topology layouts that turn red or yellow the moment an interface drops packets. This continuous polling allows technicians to diagnose exactly where a connection failed before end users even have the chance to submit a help desk ticket.
Key Features
- Feature Name: NetPath Visual Troubleshooting. NetPath visualizes the exact route network traffic takes from a source to a destination, displaying each hop across internal networks, internet service providers, and cloud endpoints. Instead of staring at text-based traceroute outputs, administrators look at an interactive node graph showing transit delays and packet loss at specific junctions.
- Feature Name: PerfStack Cross-Stack Data Correlation. Troubleshooting intermittent slowdowns often requires comparing metrics from entirely different systems. PerfStack provides a drag-and-drop interface where users pull historical data points—such as router CPU utilization, SQL disk latency, and switch port bandwidth—onto a single shared timeline. This visual correlation immediately highlights whether a storage latency spike happened at the exact same millisecond a backup job saturated the core network switch.
- Feature Name: Intelligent Topology Mapping. Keeping network diagrams updated manually is an impossible task in a growing company. The application uses the Orion discovery engine to continuously scan IP ranges, pulling device relationships and interface connections. It generates live, interactive maps that display link speeds and current utilization percentages. If a primary fiber link goes down and traffic reroutes to a backup connection, the topology map updates automatically to reflect the new active path.
- Feature Name: Dependency-Aware Alerting System. Alert fatigue happens when a core distribution switch fails, triggering hundreds of individual alerts for every unreachable endpoint downstream. The alerting engine supports nested conditions and parent-child dependencies. Administrators configure the logic so that if the parent switch stops responding, the system suppresses notifications for the dependent nodes and only sends one critical alert targeting the root cause.
- Feature Name: Network Insight for Advanced Devices. Standard SNMP polling only reports basic uptime and interface traffic, which is insufficient for complex hardware. Network Insight modules pull specialized telemetry from F5 BIG-IP load balancers, Cisco Nexus switches, and Palo Alto firewalls. For an F5 device, the interface shows the exact status of load balancing pools, virtual servers, and member node health, meaning network engineers do not have to log directly into the firewall to check traffic routing rules.
- Feature Name: Hardware Health and Capacity Forecasting. Beyond tracking current traffic, the system pulls hardware telemetry including chassis temperatures, fan speeds, and power supply voltages. The database logs this information over months to calculate exhaustion dates for critical components. The capacity planning module looks at historical bandwidth consumption and predicts the exact month a WAN circuit will reach maximum utilization.
How to Install SolarWinds Network Performance Monitor on Windows
- Download the executable Orion Installer package from the SolarWinds Customer Portal and execute the file as an administrator on the target Windows host machine.
- Allow the installer to run its initial environmental check, which will automatically deploy necessary background roles such as the .NET Framework and Microsoft Message Queuing (MSMQ) if they are not already active.
- Choose the appropriate installation path from the initial prompt: select the lightweight installation option to install SQL Server Express for a quick trial evaluation, or the standard installation option to connect to a production-grade SQL Server instance.
- Specify the local disk destination folder for the core application files, keeping in mind that the host drive needs sufficient space for daily log generation and system diagnostics.
- Review the pre-flight system check report, which flags any blocking issues like pending Windows reboots, missing IIS components, or insufficient allocated RAM, and resolve these before proceeding.
- Accept the end-user license agreement and wait for the wizard to extract the platform modules, install the Orion web console, and configure the background polling services.
- Launch the SolarWinds Configuration Wizard, which opens automatically after file extraction, to define the database connection by entering the hostname, port, and authentication credentials for your target SQL Server.
- Complete the wizard by defining the website port bindings for the web interface, generating the initial administrative account, and clicking finish to trigger the final background service startup sequence.
SolarWinds Network Performance Monitor Free vs. Paid
SolarWinds Network Performance Monitor utilizes a tiered pricing model based on the number of elements monitored in the infrastructure. An element is defined as a node (a router, switch, or server), an interface (a specific port on a switch), or a volume (a monitored logical disk). Organizations must calculate their total element count to choose the correct license size, meaning a company monitoring a single 48-port switch may consume 49 elements if every port is tracked.
The vendor offers two purchasing paths: annual subscriptions and perpetual licenses. Subscription tiers typically start around $1,638 per year, which covers the baseline node allowance, standard platform features, and ongoing technical support. Perpetual licenses require a larger upfront capital expenditure but secure permanent access to the purchased edition, with the first year of maintenance included. Subsequent years of support and feature updates for perpetual licenses require paying an active maintenance renewal fee.
For teams looking to evaluate the tool, SolarWinds provides a fully unlocked 30-day trial. This trial period does not restrict core functionality, allowing engineers to test visual tracing, cross-stack correlation, and automated topology discovery in a live environment. Once the 30-day window expires, polling engines stop collecting data until a valid license is applied through the web console administration settings. The platform does not offer a permanently free tier for enterprise deployments.
SolarWinds Network Performance Monitor vs. PRTG Network Monitor vs. ManageEngine OpManager
PRTG Network Monitor operates on a sensor-based flat pricing model, where every monitored metric counts as a single sensor. This approach appeals to smaller networks or localized Windows environments where setup speed is a priority. PRTG consolidates its entire architecture into a straightforward installation that does not require a dedicated external SQL database, making it exceptionally fast to deploy. However, large enterprises often find that managing tens of thousands of individual sensors becomes administratively taxing compared to element-based management.
ManageEngine OpManager targets mid-market IT departments looking for a practical monitoring suite at a lower initial cost. It provides excellent out-of-the-box dashboards, straightforward bandwidth analysis, and physical server monitoring without requiring expensive add-on modules. While OpManager is cost-effective and covers most standard protocols, its visual troubleshooting tools do not match the depth of drag-and-drop cross-stack timelines when tracking complex, multi-vendor intermittent faults.
SolarWinds Network Performance Monitor is the better fit for enterprise environments with complex routing, extensive multi-vendor hardware, and deep reporting requirements. When network engineers need specialized modules to interrogate F5 load balancers, visual hop-by-hop latency mapping across cloud providers, and customized dependency logic for alert suppression, the Orion platform provides a much higher ceiling for technical configuration.
Common Issues and Fixes
- High database utilization causing slow console load times. The polling engine generates immense amounts of traffic data that can overwhelm poorly configured storage. To fix this, ensure the SQL database is hosted on dedicated solid-state storage rather than spinning disks, and run the Orion database maintenance utility to rebuild fragmented SQL indexes.
- Alert fatigue from hundreds of false positive notifications. When a core distribution switch goes offline, the system will naturally fail to poll any devices connected behind it, generating a flood of alerts. Administrators must edit their alert logic to configure parent-child dependencies, which suppresses downstream device notifications and only fires a single alert for the actual dead switch.
- Orion Configuration Wizard hanging during installation. Strict server security policies or active antivirus scanning can lock files while the wizard attempts to build the database schema. Temporarily disable third-party endpoint protection on the host server during the configuration phase, and verify that the SQL server firewall explicitly allows incoming connections over TCP port 1433.
- WMI polling failures returning access denied errors on Windows targets. The polling engine requires specific administrative rights to pull hardware and application metrics via Windows Management Instrumentation. Verify that the monitoring service account is added to the local administrators group on the target machine, and ensure Windows Firewall rules are configured to permit inbound WMI traffic.
Version 2025.4.1 — December 2025
Added:
- Enhanced host header validation for improved security
- Cloud infrastructure discovery and management from Settings menu
Improved:
- Security hardening to prevent Host header injection attacks
Fixed:
- Various platform-level security and stability fixes
Security:
- Host header validation to block unauthorized access attempts