When diagnosing unexplained system crashes, identifying the exact failing hardware component often feels like chasing shadows. A sudden blue screen could point to faulty memory, an underperforming power supply, or a degraded motherboard. The Intel Processor Diagnostic Tool exists to eliminate the processor from that list of suspects. Built directly by the hardware manufacturer, this dedicated utility interacts with the internal microcode of the CPU to run targeted checks against factory specifications. It does not guess or estimate health based on operating system behavior; it sends specific mathematical and architectural commands directly to the silicon and waits for the exact expected response to verify computational accuracy.
System builders, IT administrators, and hardware enthusiasts rely on this software specifically to validate purchases and test base stability. In the secondary hardware market, deceptive sellers sometimes alter the physical heat spreader of a cheaper processor to look like a high-end model. This utility immediately exposes those discrepancies by reading the immutable hardware identification strings directly from the die. Beyond fraud detection, the application serves as a strict stability auditor. If a computer shuts down randomly during heavy rendering workloads or daily operations, running this specialized routine forces the processor through a structured obstacle course. By isolating the computation tasks from the graphics card and system memory, it pinpoints whether the logic gates within the CPU are calculating incorrectly due to degradation, extreme heat, or insufficient voltage.
A standalone desktop application is strictly necessary for this level of hardware interrogation. Browser-based diagnostics cannot access the low-level model-specific registers required to verify advanced vector extensions or integrated memory controllers. The software requires direct administrative access to the host operating system to bypass software abstractions and push the processor hardware directly. By operating natively on the desktop, it ensures that background applications do not interfere with the strict timing and mathematical verification required to stamp a processor as physically sound and safe for deployment.
Key Features
- Brand Identification and Authenticity Validation: The application immediately queries the internal hardware registers to retrieve the hardcoded brand string and CPUID. It compares the expected processor name against the actual silicon response, quickly flagging counterfeit chips or incorrect motherboard firmware configurations.
- Targeted Module Checklists: Instead of applying a generic computational load, the software isolates specific architectural blocks such as the Integrated Memory Controller (IMC) and the processor cache. By testing these individual pathways one by one, users can identify exactly which part of the die is failing during heavy workloads.
- Operating Frequency Verification: The utility measures both the base clock and the maximum turbo frequency under active load to ensure the motherboard is supplying the correct parameters. This confirms that the processor actually reaches its advertised speeds rather than aggressively throttling due to misconfigured firmware or inadequate cooling.
- Configurable Test Presets: Navigating to the Tools menu and selecting Config, then Presets reveals three distinct testing modes for different diagnostic scenarios. Users can run a Quick Test for basic identification, a Full Functional Test that takes about four minutes, or a looping Burn-In Test designed to run for hours to catch intermittent thermal anomalies.
- Advanced Instruction Set Auditing: The diagnostic routine explicitly calls upon modern instruction sets such as SSE, AVX, and AES to verify that these specialized processing units return accurate mathematical results. If a processor has sustained microscopic damage from extreme overclocking, these specific mathematical checks often fail before the rest of the system crashes.
- Real-Time Thermal Safeguards: As the stress testing modules push the hardware to maximum electrical draw, the interface actively monitors die temperatures and distance to the maximum thermal junction limit. If the cooling solution fails and temperatures reach critical thresholds, the application automatically halts the routine to prevent physical damage to the silicon.
- Detailed Log Export: Upon completing or failing a diagnostic run, the application generates a detailed text file outlining the specific modules tested, the time taken, and the exact error codes encountered. Support technicians and warranty departments frequently request this log file to authorize hardware return merchandise authorizations.
How to Install Intel Processor Diagnostic Tool on Windows
- Download the official 64-bit Windows installer package directly to your local drive.
- Locate the downloaded MSI or executable setup file in your directory and double-click to launch the installation wizard.
- Grant the necessary Administrator privileges when the User Account Control prompt appears, as the setup needs to register low-level hardware drivers to communicate with the microcode.
- Accept the end-user license agreement and proceed to the destination folder selection, leaving the default path set to your main program files directory to ensure proper file permissions.
- Click the Install button and wait for the wizard to unpack the core diagnostic modules and graphical interface components.
- Click Finish to close the setup wizard, then launch the application from the Start menu shortcut.
- On the first launch, the software will immediately begin scanning system configurations and automatically start executing the default Full Functional Test, so expect a sudden increase in fan noise as the stress test begins.
Intel Processor Diagnostic Tool Free vs. Paid
The Intel Processor Diagnostic Tool is distributed as entirely free software. There are no paid tiers, no professional upgrades, and no recurring subscription fees required to access its complete diagnostic capabilities. The vendor provides this utility as a supporting mechanism to reduce unnecessary hardware returns and help technicians isolate faults accurately without purchasing third-party diagnostic software.
Because the software targets physical hardware validation rather than commercial benchmarking, all advanced features remain unlocked for every user. The command-line interface, automated burn-in looping, and detailed text log exports are fully accessible in the standard download. Enterprise IT departments do not need to negotiate site licenses to deploy the tool across massive fleets of corporate workstations, and home users receive the exact same diagnostic depth as a certified hardware engineer.
Intel Processor Diagnostic Tool vs. Prime95 vs. Cinebench
Prime95 utilizes prime number calculations to generate a massive, sustained load on the processor, creating immense heat and drawing maximum electrical current. Overclockers prefer Prime95 when they want to test the absolute maximum thermal dissipation of their custom cooling loops or verify that a heavily modified voltage curve remains stable under an unrealistic, worst-case scenario load. It is an extreme torture test, whereas the official diagnostic is a structural validation tool.
Cinebench serves an entirely different purpose, operating as a 3D rendering benchmark based on a commercial rendering engine. Users run Cinebench when they want to assign a numerical score to their system and compare their processing speed against competing architectures or different generations of hardware. It is a performance metric utility rather than a strict diagnostic tool, meaning it will show how fast a processor calculates a scene, but it will not specifically isolate a failing memory controller or verify the processor brand string.
The Intel Processor Diagnostic Tool is the correct choice when the goal is validation rather than competition. Instead of generating a high score or melting a thermal paste application, it provides a binary pass or fail result based on factory specifications. If a user suspects their computer is crashing due to silicon degradation, or if they need official proof of a hardware failure to process a warranty claim, this vendor-specific utility provides the exact log files and module-specific error codes required to justify a replacement.
Common Issues and Fixes
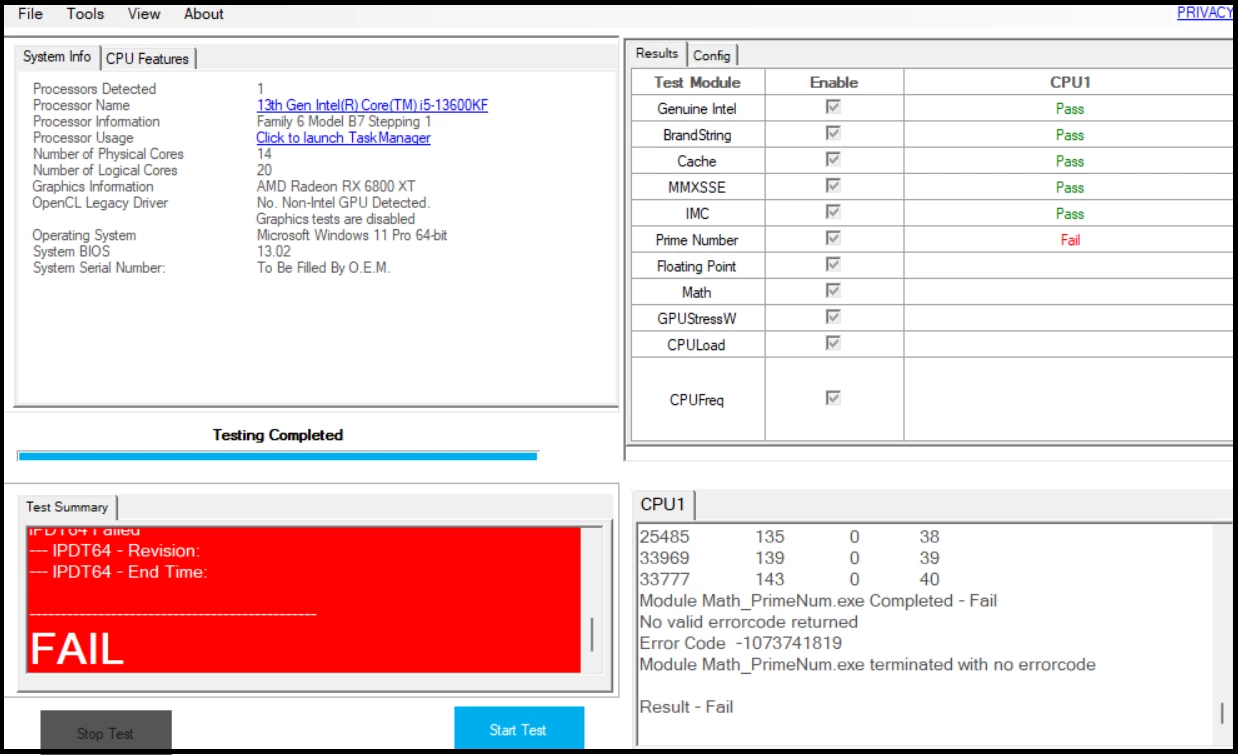
- The application fails the Brand String or Genuine Intel test immediately upon launch. This failure occurs if the motherboard chipset drivers are severely corrupted, if the BIOS is incorrectly identifying the processor, or if the system actually contains a non-Intel processor. To fix this, download and install the latest chipset drivers from your motherboard manufacturer website, update your motherboard BIOS to the newest revision, and verify the physical processor installed in the socket.
- The stress test halts with a Prime Number Fail error code. A prime number calculation failure strongly indicates that the logic gates inside the processor are making mathematical errors, usually due to insufficient voltage or permanent hardware degradation. Resolve this by entering the motherboard BIOS, disabling any automatic overclocks or undervolting profiles, reverting to default factory settings, and running the test again.
- The utility crashes or reports an error during the graphics module test. This issue frequently points to unstable or outdated drivers for the processor internal graphics engine, rather than a failure of the computational cores themselves. Fix this by navigating to the vendor driver page, downloading the latest integrated graphics driver for your specific processor generation, and performing a clean installation.
- The diagnostic run abruptly stops with a temperature warning before completion. The software actively monitors internal thermal sensors and will trigger an abort if the processor approaches its maximum safe operating temperature. Correct this by checking your cooling solution; ensure the heatsink fans are spinning, clean away any accumulated dust from the radiator fins, and consider reapplying high-quality thermal paste between the processor and the cooler.
- The tool fails to launch and requests elevated permissions. Because the application communicates directly with low-level system hardware, it cannot run under standard user restrictions. Fix this by right-clicking the desktop shortcut or Start menu icon and selecting Run as administrator to grant the necessary hardware access rights.
Version 4.1.9.41 — January 2024
- Added official support for 14th Generation Intel® Core™ processors.
- Implemented a run-time check to block execution on unsupported third-party processors.
- Updated all diagnostic modules to improve functionality and resolve bugs.
- Included various functional enhancements and security updates.