Wireshark operates as a network protocol analyzer that captures data packets moving across a local network and translates them into a highly detailed, human-readable format. Network administrators, security engineers, and software developers rely on this application to diagnose traffic latency, pinpoint exact points of failure in database connections, and inspect protocol-level interactions. Instead of relying on application-level error messages or vague browser timeouts, professionals use this tool to read the exact sequence of bytes traveling between network nodes. It exposes misconfigured DNS responses, dropped TCP segments, plain-text authentication attempts, and abnormal routing behavior by translating hexadecimal raw data into structured, collapsible syntax trees showing Ethernet, IP, TCP, and application-layer headers.
Packet capture requires interacting directly with network interface controllers at the operating system level, intercepting raw frames before the host firewall or application layer processes them. A standard web browser or lightweight diagnostic utility cannot access this lower OSI layer. The desktop interface provides deep filtering capabilities necessary for this type of forensic analysis, allowing users to sift through millions of captured packets to isolate a single failed TLS handshake or a malformed HTTP request. Because network troubleshooting often involves examining highly specific timing delays and bit-level flags, the local desktop environment provides the processing capacity needed to render large capture files quickly and accurately.
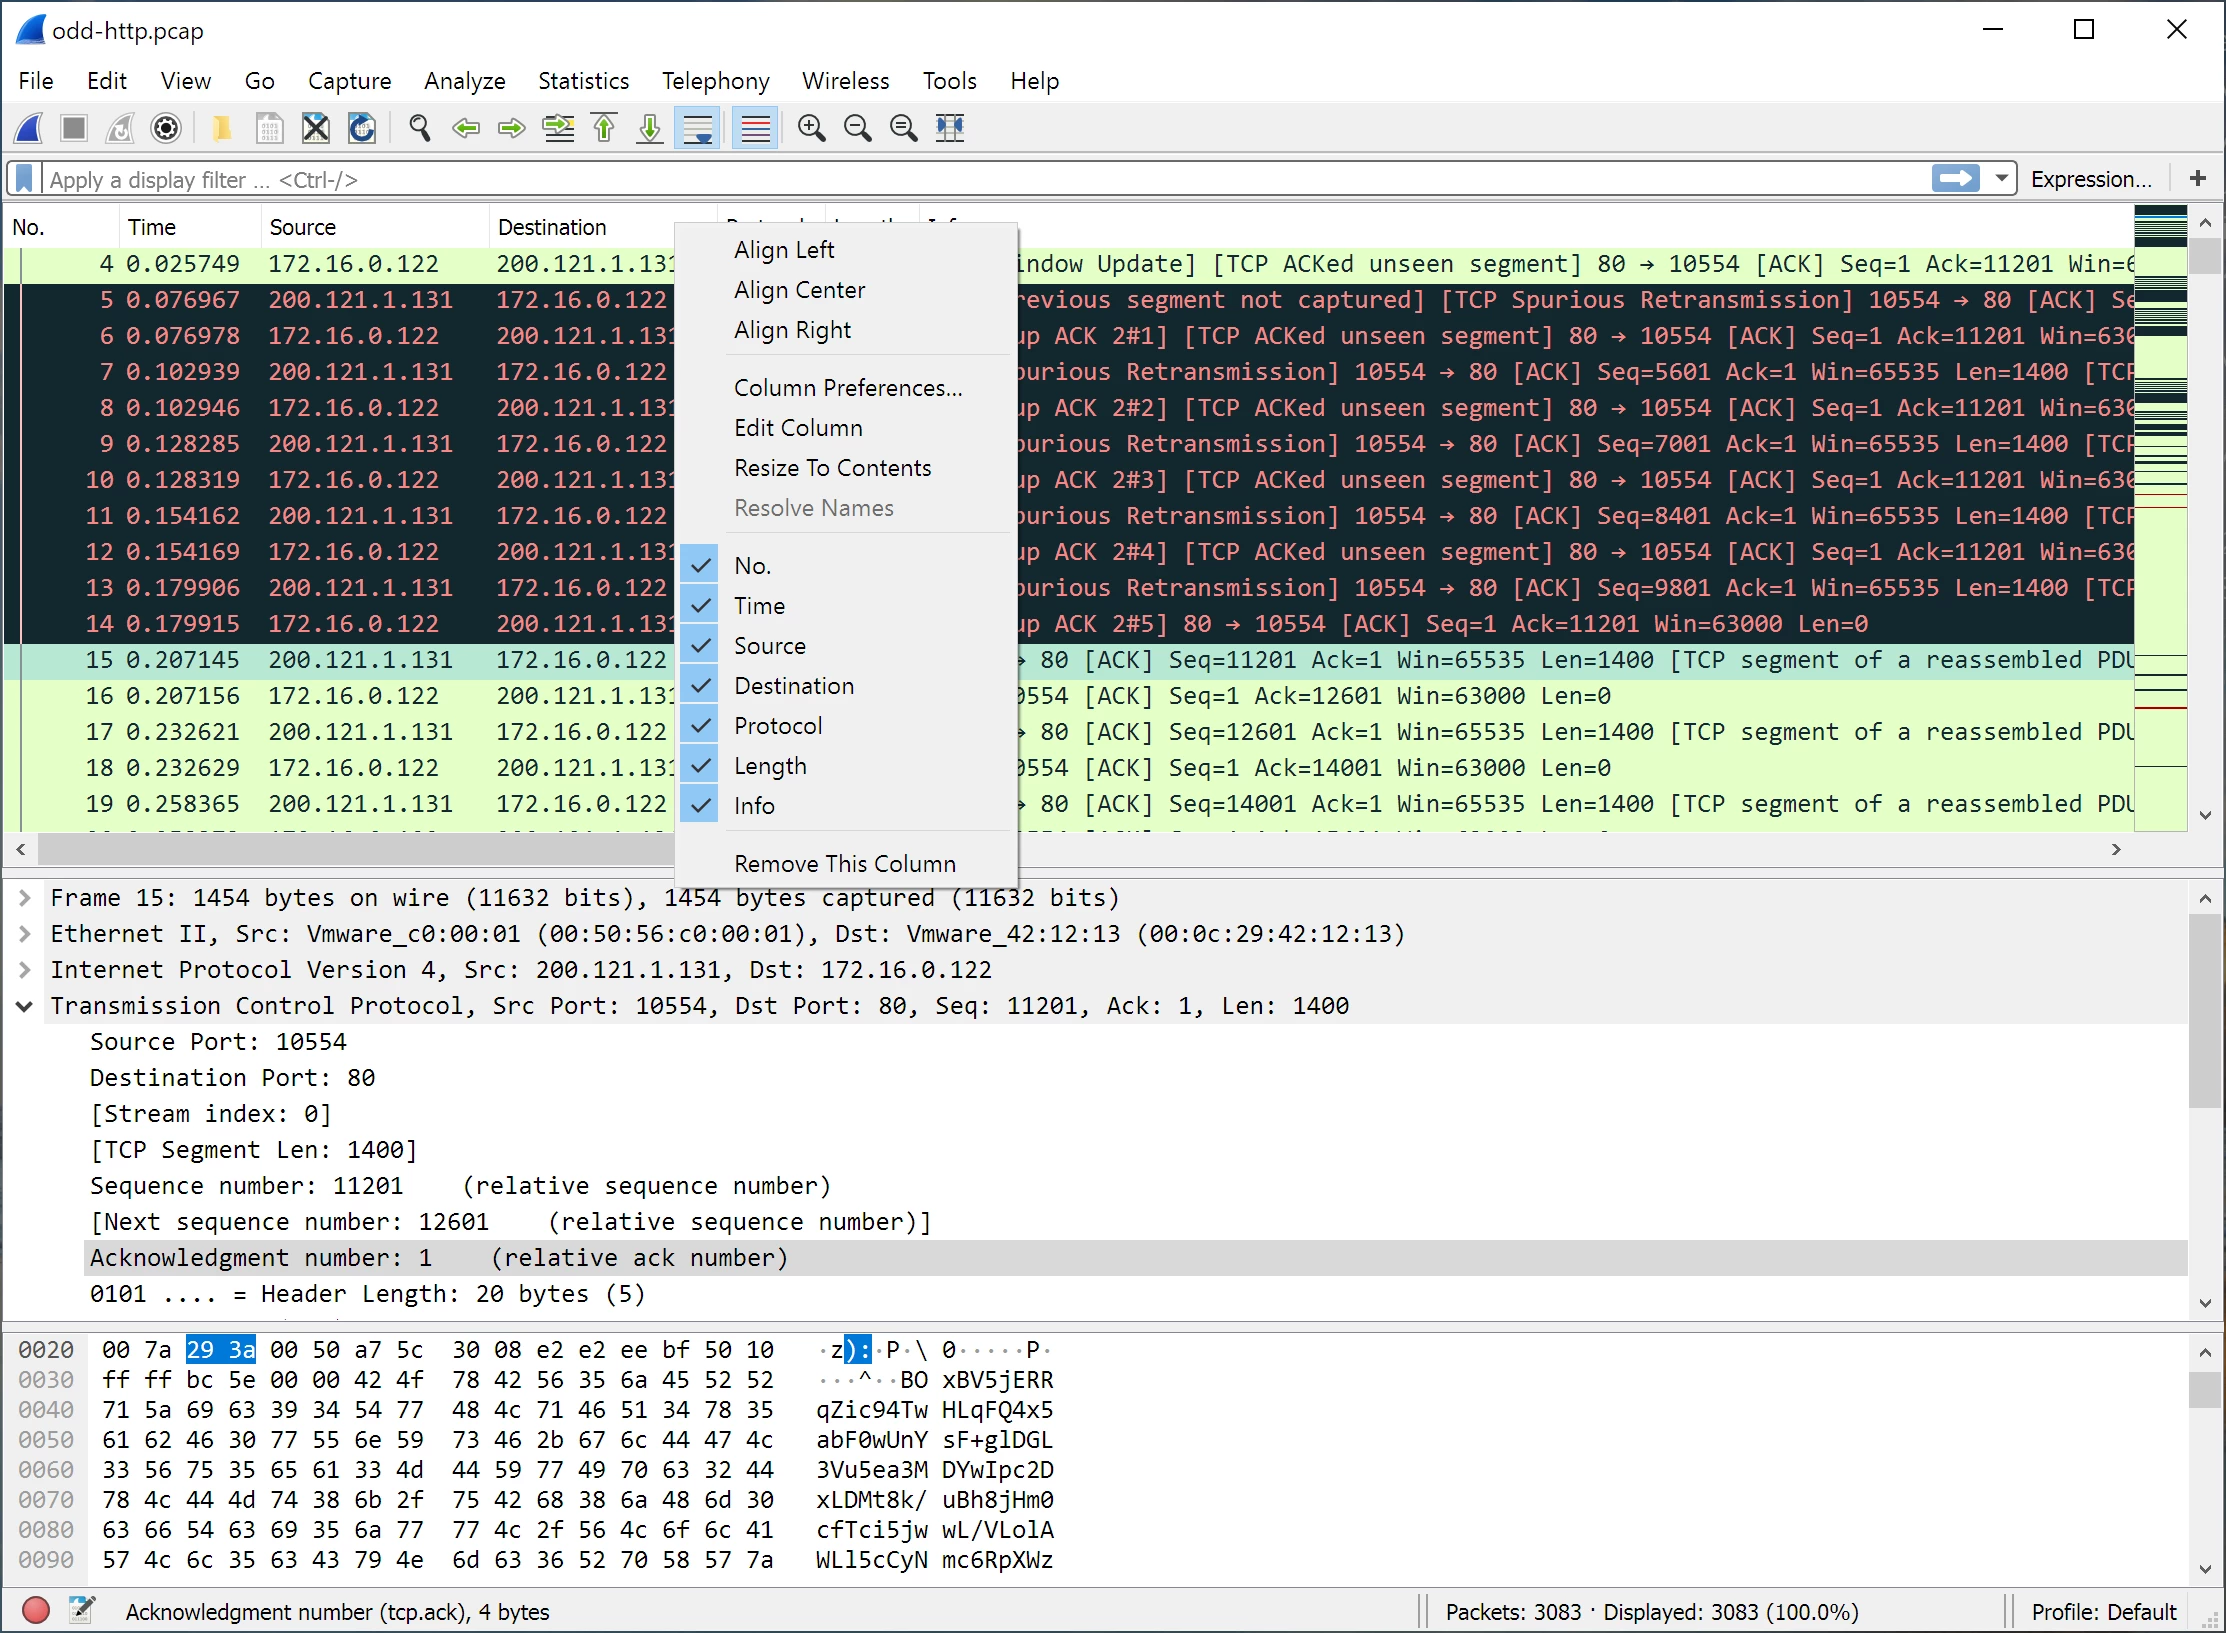
When an engineer needs to prove that a switch is dropping packets or a backend server is refusing connections, they turn to this interface for concrete evidence. The application breaks down complex network behavior into three distinct views: a chronological packet list, a detailed protocol tree displaying exact header fields, and a raw byte pane. By exposing exactly what information leaves the machine and what information returns, it removes the guesswork from network administration. Users can verify whether a remote server actually sent a reset packet or if a local firewall silently dropped the outbound request, making it an essential utility for verifying network infrastructure behavior.
Key Features
- Deep Protocol Dissection: The software understands hundreds of network protocols, breaking down packet headers into a collapsible tree view in the middle details pane. Users can expand the Transmission Control Protocol section to view exact bit fields for flags like SYN, ACK, and FIN, or expand the Internet Protocol section to verify source and destination routing addresses.
- Live Capture and Offline Analysis: The application captures traffic directly from Ethernet or Wi-Fi adapters using the Npcap library on Windows. Users can save these traffic traces in the standard .pcapng file format for later analysis, allowing engineering teams to share exact network dumps for collaborative troubleshooting across different time zones.
- Display Filters: The interface includes a dedicated filter bar that accepts specific syntax, such as typing tcp.port == 443 or http.request.method == "GET", to hide irrelevant background noise. The text box turns green when the syntax is mathematically valid and red when invalid, preventing operators from wasting time on misspelled queries.
- TCP Stream Assembly: The Follow TCP Stream menu option extracts the payload of a specific connection and displays the entire conversation in a separate, continuous text window. Client requests are colored red and server responses are colored blue by default, making it simple to read full HTTP exchanges, database queries, or unencrypted text protocols.
- Object Extraction: Analysts can extract files transferred over unencrypted protocols directly from the network trace. Navigating through File, then Export Objects, allows the user to rebuild downloaded payloads from HTTP, SMB, or TFTP traffic and save the reconstructed files locally for malware analysis or data verification.
- Coloring Rules: The packet list pane applies distinct background colors to individual rows based on the protocol type or specific error states. Light blue lines indicate UDP traffic, light purple indicates TCP traffic, and black lines with red text denote problematic traffic such as TCP retransmissions, duplicate acknowledgments, or out-of-order packets.
How to Install Wireshark on Windows
- Download the official Windows installer executable from the foundation server and double-click the file to launch the setup wizard.
- Agree to the GNU General Public License terms and review the component selection screen, keeping the default checkboxes enabled for the main application graphical interface and the TShark command-line utilities.
- Choose your preferred shortcut locations for the start menu and desktop, then confirm the default installation path in the Program Files directory.
- When the wizard prompts you with the Npcap installation step, ensure the box is checked to install this driver, as the application requires it to capture live network frames from your Windows network interface cards.
- Decide whether to select the optional USBPcap component, which is only necessary if your troubleshooting workflow specifically requires monitoring USB hardware traffic rather than standard network traffic.
- Complete the secondary Npcap installation dialogue that appears, reviewing options such as restricting driver access to local Administrators if your environment requires strict security policies.
- Finish the main setup wizard, close the installer, and launch the application using administrative privileges to ensure the local network adapters populate correctly in the startup capture menu.
Wireshark Free vs. Paid
Wireshark operates entirely under an open-source model and requires no commercial licenses, subscriptions, or recurring billing. The Wireshark Foundation maintains the software under the GNU General Public License (GPL), making the full diagnostic feature set available to all users without restrictions on capture sizes, export limits, or time constraints. Any user can download the application, compile the source code, and use it for commercial diagnostic work without paying software fees.
There are no restricted tiers hidden behind a paywall. Features like TLS decryption, advanced display syntax, protocol extraction, and command-line utilities are fully included in the standard Windows distribution. IT departments and corporate network teams can deploy the analyzer across hundreds of employee workstations or datacenter servers without triggering commercial compliance audits or monitoring seat counts.
While the desktop application itself costs nothing, users occasionally incur costs if they choose to integrate third-party hardware capture appliances, specialized TAP devices, or commercial network monitoring platforms that parse exported capture files. Furthermore, official training and certification programs, such as the Wireshark Certified Network Analyst credential, require paid exam fees. However, these educational tracks and hardware additions are completely optional for operating the software and diagnosing daily network issues.
Wireshark vs. Fiddler vs. GlassWire
Fiddler operates as a web debugging proxy rather than a raw hardware packet sniffer. It sits at the application layer, specifically capturing HTTP and HTTPS traffic by acting as a middleman between the web browser and the internet. This configuration makes it highly efficient for web developers inspecting REST API calls, modifying headers on the fly, and troubleshooting web server performance. However, Fiddler ignores lower-level network protocols, meaning it cannot diagnose ARP broadcast issues, raw DNS packet drops, or TCP retransmission errors.
GlassWire focuses on endpoint network security and visual bandwidth monitoring for individual workstations. It provides graphical charts showing which local applications consume the most data, alerts users to new executable network activity, and offers a built-in firewall control interface. It is designed for general desktop users who want visual insights into their data consumption, but it lacks the deep packet dissection, hex-level viewing, and granular protocol inspection required for forensic network engineering.
Wireshark remains the superior choice for deep diagnostic work that extends beyond simple web requests or basic bandwidth graphs. When an engineer needs to prove that a physical switch is dropping frames, analyze a slow database handshake, or inspect a proprietary UDP broadcast, this application provides the exact byte-level visibility required to pinpoint the root cause of the network failure.
Common Issues and Fixes
- No network interfaces listed on startup. This occurs when the capture driver fails to initialize or the user lacks permission. Close the application, ensure the Npcap service is running by typing net start npcap in an administrative command prompt, and relaunch the application as an administrator.
- Encrypted web traffic appears unreadable. Modern traffic secured by TLS displays only as encrypted application data. To read the underlying HTTP exchanges, configure your Windows environment to export session keys using the SSLKEYLOGFILE variable, then point the analyzer's TLS protocol preferences to that specific text file.
- Large capture files consuming all system RAM. Capturing high-volume gigabit links fills up local memory quickly, causing the application to stall. Instead of capturing infinitely into a single file, open the capture options and configure a ring buffer to split the capture into multiple smaller files, limiting each to 100 megabytes.
- Promiscuous mode fails to capture other device traffic. Checking the promiscuous mode box often fails to show traffic from other computers on modern switched networks or Wi-Fi adapters. To see traffic outside of your own machine's broadcasts, you must configure a managed network switch to use port mirroring (SPAN) to forward the desired traffic directly to your capture interface.
- Packets missing from the local capture view. The Windows network adapter might drop or aggregate packets due to hardware offloading features. Open the Windows network adapter properties in the control panel and disable Checksum Offload and Large Send Offload (LSO) to capture raw traffic accurately before the network card alters it.
Version 4.6.2 — December 2025
- Resolved a critical compatibility regression introduced in version 4.6.1 that prevented plugins built for 4.6.0 from loading correctly.
- Fixed a security vulnerability in the HTTP3 dissector that caused a crash when decrypting certain traffic.
- Addressed a denial-of-service issue in the MEGACO dissector where specific packets could trigger an infinite loop.
- Restored the ability to properly read and process Omnipeek capture files, which was broken in the previous release.
- Corrected a stack buffer overflow error within the BER file reading module (wiretap).
- Updated protocol support for HTTP3, GTP, IEEE 802.15.4, MEGACO, and several others to ensure accurate dissection.
- Upgraded the bundled Visual C++ Redistributable in Windows installers to version 14.44.35112.