AIDA64 Extreme operates as a dedicated hardware diagnostic and system information utility for PC builders, overclockers, and hardware enthusiasts. The software interrogates local hardware components to extract highly granular specifications, sensor data, and performance metrics. Users rely on this tool to verify memory timings, monitor thermal output during heavy workloads, and validate system stability after adjusting BIOS settings. By scanning a massive internal hardware database, the application identifies undocumented components and displays their exact operating parameters without requiring users to open the computer case. This level of detail is critical when verifying the true specifications of second-hand hardware, ensuring that a graphics card or processor matches its advertised capabilities rather than being a counterfeit component flashed with a fake BIOS.
Unlike lightweight monitoring gadgets or browser-based system scanners, this desktop application utilizes low-level hardware access to read data directly from motherboard sensors, GPU diodes, and storage controllers. Web browsers physically cannot interact with system management buses (SMBus), read proprietary thermal diodes, or query PCI Express lane configurations. A local Windows application running with administrator privileges is strictly required to poll these deep system registers. This direct hardware access allows the software to track exact voltage drops, motherboard VRM temperatures, fan RPM changes, and thermal throttling events in real time. Enthusiasts rely on this direct polling to ensure their cooling loops are reacting correctly to sudden spikes in package power.
Beyond passive monitoring, the application includes synthetic workload generators to stress test individual components safely. Overclockers use these tools to push the CPU, floating-point unit (FPU), cache, and system memory to maximum thermal limits in a controlled environment. If a new memory kit or processor frequency is unstable, the built-in diagnostic routines will detect hardware arithmetic errors or physical thermal throttling. This gives system builders the concrete baseline data needed to adjust their liquid cooling curves, reapply thermal paste, or modify core voltage settings for long-term daily use without risking system crashes during actual work workloads.
Key Features
- Hardware Detection Engine: The application scans an internal database of over 170,000 hardware devices to identify exact component models, chipset revisions, and microarchitectures. This allows users to view raw data like PCI Express lane configurations, CPU stepping, and monitor EDID details directly in the Computer and Motherboard tabs. It eliminates the need to guess which specific hardware revision is installed by reading the raw hardware identification strings.
- Real-Time Sensor Monitoring: The software reads data from over 250 distinct sensor devices across the motherboard, graphics card, and storage drives. Users can monitor VRM temperatures, pump speeds for custom liquid cooling loops, and individual core power draw in watts directly from the Sensor page. This real-time polling updates continuously to reflect sudden load changes when launching demanding applications.
- System Stability Test: Accessible via the Tools menu, this module applies a multi-threaded synthetic load to the processor, memory, and local disks. It plots temperature, voltage, and clock speed on a live graph, halting automatically if it detects hardware calculation errors or severe thermal throttling. This acts as a primary validation tool for new system builds before deploying them into daily usage.
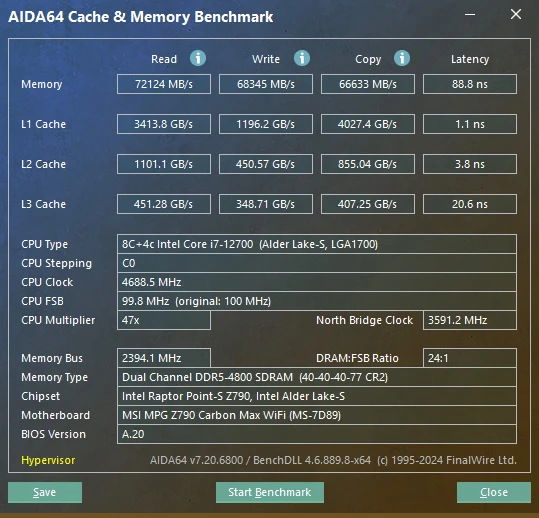
- Synthetic Benchmarks: The application includes a suite of micro-benchmarks such as CPU Queen, CPU PhotoWorxx, memory read/write/copy speeds, and memory latency tests. These tools help users measure the exact performance gain or loss after changing RAM timings or processor clock multipliers in the system BIOS. The results can be compared against a built-in database of reference systems, allowing users to see exactly where their machine ranks.
- Customizable SensorPanel: Users can build a custom hardware monitoring dashboard that sits directly on the Windows desktop, using custom background images, line graphs, and gauge meters. The panel can display any polled sensor value, such as GPU memory utilization or CPU socket temperature, updated in real time. Enthusiasts often size these panels to fit dedicated internal case monitors mounted on the chassis glass.
- External Display Integration: The software supports outputting live sensor data to external LCD and VFD screens, including Logitech gaming keyboards and dedicated USB monitoring displays. This allows users to track system vitals while running full-screen applications without needing a secondary desktop monitor. The layout for each screen type can be customized directly in the preferences menu.
- Software and Operating System Audit: Beyond hardware, the utility scans the local operating system to catalog installed programs, active security software, and Windows licenses. It generates lists of running processes, active services, DLL files, and startup applications. This helps administrators document system states before deploying major updates, troubleshooting software conflicts, or modifying critical registry keys.
How to Install AIDA64 Extreme on Windows
- Download the official Windows installer executable package from the vendor's primary download servers.
- Launch the downloaded setup file and grant the required Windows User Account Control (UAC) permissions, which allows the installer to execute with the necessary administrator rights.
- Review and accept the End User License Agreement, then select the destination folder on your local storage drive where the application files will reside.
- Choose whether to create a desktop shortcut and a quick launch icon, then proceed with the file extraction and standard installation process.
- Finish the setup wizard and launch the application. During the initial splash screen, the software will perform an initial low-level scan of your PCI devices, DMI data, and motherboard sensors to build the local hardware tree.
- If you use an unactivated installation, note that the interface will immediately restrict certain data fields with trial text until a valid product key is entered.
- Navigate to the File menu, select Preferences, and open the Stability tab to adjust low-level hardware detection settings if you run competing monitoring utilities like Corsair iCUE or ASUS Armoury Crate.
AIDA64 Extreme Free vs. Paid
AIDA64 Extreme requires a paid commercial license for long-term use, operating under a perpetual license model with a set period of maintenance updates. The vendor provides a 30-day free trial so users can test compatibility with their specific motherboard sensors, storage controllers, and external LCD displays before committing to a purchase. Because hardware monitoring relies heavily on specific motherboard controllers, this trial is essential for verifying that the software reads custom water pump speeds or specific thermal diodes correctly on a particular build.
During the 30-day trial period, the software applies a strict text watermark to the visual output. Specifically, it hides certain data fields, hardware values, and benchmark results by displaying the words "TRIAL VERSION" across various rows in the interface and inside exported reports. This restriction prevents users from utilizing the tool for complete hardware audits or full benchmarking runs without purchasing a license, as crucial data points will simply be masked.
To remove these trial restrictions, users must purchase a license key directly from the vendor or an authorized reseller. Entering the valid product key in the Help menu immediately unlocks all hidden sensor data, enables full HTML and CSV report generation, and grants access to software updates for the duration of the maintenance period. Once the maintenance period expires, the perpetual license allows the user to continue using their current build indefinitely, though they will not receive updates for newly released hardware unless they renew the maintenance plan.
AIDA64 Extreme vs. HWiNFO64 vs. HWMonitor
HWiNFO64 is a free hardware monitoring utility that focuses almost entirely on providing an exhaustive, dense list of sensor data. Users who only need to check raw temperatures, voltages, and detailed hardware specifications often choose HWiNFO64 because it provides low-level sensor polling without requiring a paid license. It reads many of the same proprietary motherboard sensors, but it lacks the built-in synthetic benchmarks, the visual SensorPanel desktop module, and the automated stress testing tools found in a fully commercial diagnostic suite.
HWMonitor is a much lighter, simpler tool designed to display a basic, vertical tree view of current, minimum, and maximum temperatures, voltages, and fan speeds. It is an excellent choice for users who want a fast, zero-configuration utility to quickly check if a processor or graphics card is overheating under load. However, HWMonitor does not attempt to provide deep DMI data, software audits, or LCD screen integration, making it strictly a passive temperature checker rather than a dedicated diagnostic platform.
AIDA64 Extreme is the better fit for enthusiasts, system builders, and overclockers who need an all-in-one diagnostic suite. By combining deep hardware auditing, live sensor tracking, synthetic CPU and memory benchmarks, and a dedicated stress testing module, it removes the need to run multiple separate utilities. Its ability to output custom dashboards to external LCD screens and desktop panels also makes it the superior choice for users building highly customized PC setups with dedicated internal case monitors.
Common Issues and Fixes
- Problem description. The SensorPanel responds very slowly when clicking the Modify or New buttons during customization.
This delay often occurs if you are using full-resolution background images that the software is attempting to resize dynamically for every UI refresh. Disable image resizing in the panel settings and ensure your PNG files are saved at the exact native resolution of the panel to eliminate the rendering lag. - Problem description. The software fails to display SMART temperatures or health status for storage drives in a RAID array.
By default, the application disables RAID SMART polling because low-level disk calls can cause rare system lockups on certain storage controllers. To see these temperatures, navigate to File, Preferences, Stability, and manually check the box for RAID SMART support. - Problem description. Sensor readings disappear, fluctuate wildly, or conflict when running Corsair iCUE or ASUS Armoury Crate.
Running multiple hardware polling tools simultaneously can cause SMBus collisions, resulting in missing or inaccurate data as the programs fight for access. Open the Stability preferences in AIDA64 and disable the specific sensor support options for Corsair or ASUS to resolve the software conflict. - Problem description. The application causes momentary system stuttering or screen flickering when launched.
This can happen if the software attempts to wake up a dormant secondary graphics card, such as a discrete laptop GPU in an NVIDIA Optimus setup. You can stop this behavior by unchecking the "Wake up GPUs at AIDA64 startup" option in the Stability preferences menu. - Problem description. The benchmark results and certain hardware details only show "TRIAL VERSION" instead of actual numbers.
This is the standard behavior of the unactivated trial edition, which masks critical data. You must purchase a license key and enter it into the application via the Help menu to reveal the masked text and unlock full reporting functionality.
Version 8.20 — 2025
- Added support for Turing (Turzx) 5.2-inch and 8-inch LCD displays.
- Optimized memory bandwidth benchmarks for AMD Milan, Rome, and Shimada Peak processors.
- Included detailed GPU information for AMD Radeon RX 7700 and NVIDIA RTX Pro 6000D Blackwell cards.
- Fixed bugs causing SensorPanel and OSD Panel positioning errors after sleep or system restart.
- Resolved character encoding issues affecting the RemoteSensor feature.