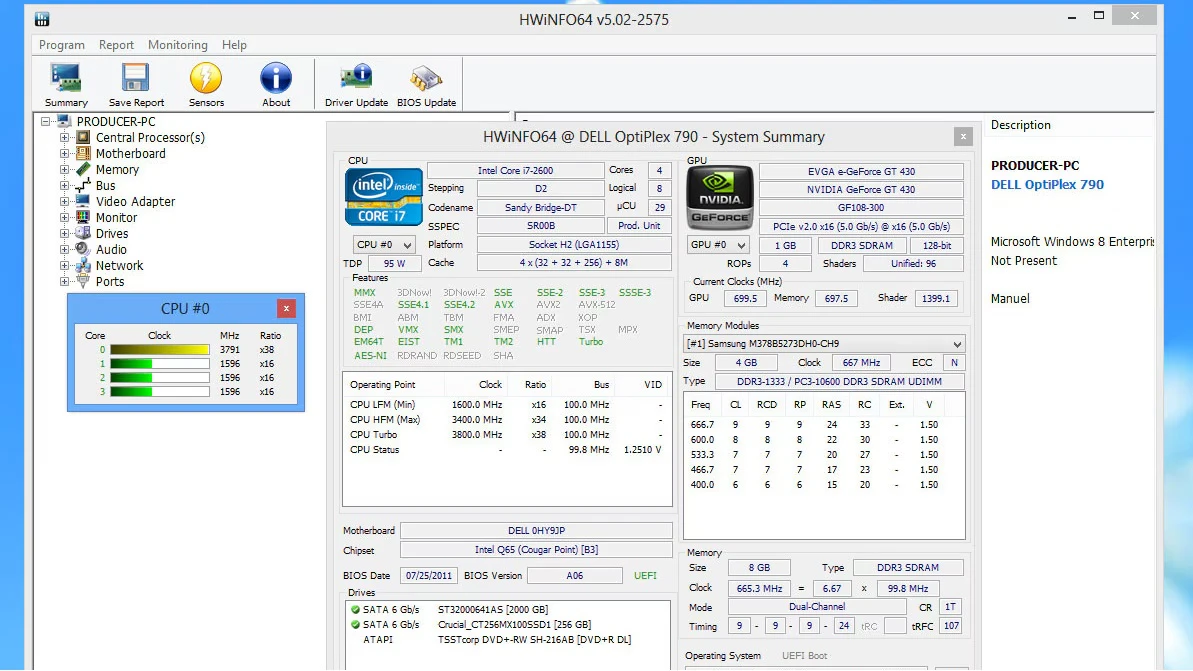
Hardware diagnostics require an unfiltered look at how a computer operates under the hood. When a system randomly shuts down during a heavy rendering task or drops frames during an intense gaming session, simple task managers do not provide enough data to identify the culprit. HWiNFO serves as a focused telemetry and diagnostic utility that extracts exact sensor data directly from the motherboard, processor, and graphics card. Instead of relying on operating system estimations, this application queries the physical silicon, reading thermal diodes, voltage regulators, and fan controllers to give users an accurate picture of their machine's health.
Because modern computer components constantly adjust their clock speeds and power draw based on thermal limits, capturing this data requires low-level access to the hardware. A desktop application is strictly necessary for this task, as web browsers and lightweight generic utilities lack the permissions to poll ring-0 hardware controllers. System administrators, custom PC builders, and overclocking enthusiasts rely on this deep integration to verify that their cooling solutions work, that their memory modules run at the correct timings, and that their power supplies deliver stable voltage under extreme loads.
By focusing entirely on data collection rather than synthetic testing or system optimization, the utility avoids background bloat. It simply reads the sensors and presents the facts. Whether the user needs to log core temperatures to diagnose a failing cooler, verify the exact microarchitecture of a second-hand processor, or feed live telemetry to an external dashboard, the software provides the exact metrics required to make informed troubleshooting decisions. It turns invisible hardware limits into readable, actionable data.
Key Features
- Complete Hardware Identification: The utility reads the exact specifications of installed components, bypassing generic operating system labels. It displays the precise microarchitecture, silicon stepping, BIOS firmware version, exact memory timings, and storage S.M.A.R.T. data, allowing users to verify their hardware exactly matches the expected retail specifications before starting a build.
- Real-Time Sensor Polling: The core of the application revolves around live telemetry presented in the main interface. It actively monitors hundreds of individual sensors across the motherboard, CPU, and GPU, providing continuous readouts for core temperatures, VRM voltages, power consumption in watts, and individual fan RPMs as the system operates under varied workloads.
- Thermal and Power Throttling Detection: Modern processors protect themselves by reducing clock speed when they get too hot or draw too much current. The software includes specific performance limit flags in the sensor list that turn from 'No' to 'Yes' the exact millisecond a component hits a thermal or power boundary, taking the guesswork out of sudden frame rate drops.
- Extensive Data Logging: Users can record sensor readings over time by exporting the data directly into CSV, XML, or HTML formats using the 'Start logging' button. By setting custom polling intervals and starting a log file before launching a demanding application, technicians can review the exact temperatures and voltages recorded right before a system crash or forced reboot.
- Shared Memory Integration: The application can expose its live sensor data to third-party overlay tools and external physical devices. By enabling the shared memory option in the general settings, users can feed real-time hardware telemetry into custom Rainmeter desktop skins, Aquasuite cooling controllers, or Stream Deck panels for at-a-glance monitoring without keeping the main window open.
- Customizable Interface Layout: Because the raw sensor list can be overwhelmingly long, the user interface allows heavy customization to improve readability. Users can right-click any row to hide irrelevant data, rename specific sensors, change text colors to highlight dangerous temperature thresholds, and reorganize the entire layout to prioritize the most critical system metrics.
How to Install HWiNFO on Windows
- Download the Windows installer executable package to your local storage drive.
- Locate the downloaded file and double-click it to execute the setup wizard, approving the User Account Control prompt to grant necessary administrative permissions.
- Read and accept the end-user license agreement presented on the first screen of the installer.
- Choose the destination folder where the application files will be extracted, or leave the default path provided by the wizard.
- Select your preferences for desktop shortcuts and Start menu folders to ensure easy access to the utility.
- Complete the installation process and click the option to launch the application immediately upon closing the wizard.
- On the initial startup prompt, check the 'Sensors-only' box if you want to bypass the static system summary and go directly to the live telemetry window.
- Click the 'Run' button to initialize the low-level hardware polling and open the main monitoring interface.
HWiNFO Free vs. Paid
The software operates on a freemium model, providing the vast majority of its diagnostic and monitoring capabilities entirely free for personal, non-commercial use. Home users, custom PC builders, and gaming enthusiasts can access the complete hardware database, view real-time sensor tracking, and utilize the standard logging tools without spending any money. The free tier does not restrict the number of sensors you can view, nor does it hide critical diagnostic flags behind a paywall. For individual troubleshooting and casual hardware monitoring, the unpaid version delivers the complete core experience.
For commercial environments, IT helpdesks, and enterprise deployments, the developer requires a paid Pro license. Purchasing this license ensures legal compliance for businesses that use the tool to diagnose client machines or manage corporate hardware assets. The revenue from the commercial tier supports the ongoing, complex technical development required to keep the sensor database compatible with new processors, motherboards, and graphics cards as they enter the market.
Beyond commercial compliance, the Pro tier unlocks a few specific advanced functionalities for power users. The most notable difference involves the Shared Memory feature, which feeds telemetry data to external applications like Rainmeter or Stream Deck. In the free version, this data feed automatically disables itself after twelve hours of continuous uptime, requiring a manual application restart. The Pro license removes this twelve-hour restriction, making it the required choice for users building permanent, always-on hardware monitoring displays. The paid version also introduces command-line data logging and enables remote monitoring capabilities for tracking multiple machines across a local network.
HWiNFO vs. HWMonitor vs. AIDA64
HWMonitor provides a much simpler and lighter approach to system telemetry, designed for quick glances rather than deep analysis. Users generally choose HWMonitor when they need an uncluttered window that displays basic temperatures, fan speeds, and voltages without forcing them to scroll through hundreds of obscure sensor readouts. While its minimal interface is accessible for beginners, it lacks the detailed throttling flags, extensive logging options, and third-party overlay integrations that advanced troubleshooters rely on to diagnose complex hardware faults.
AIDA64 operates as a premium, heavily structured diagnostic suite that excels in synthetic benchmarking, system stability testing, and automated network inventory. IT professionals frequently rely on AIDA64 to execute heavy stress tests to validate overclocking stability or to generate strictly formatted, detailed hardware reports for corporate asset management. Unlike pure monitoring tools, AIDA64 is a paid product that focuses heavily on active testing and corporate auditing rather than acting primarily as a passive background telemetry reader.
HWiNFO occupies the middle ground, offering far more technical depth than basic monitors while remaining strictly focused on passive data collection rather than synthetic benchmarking. It is the better fit for users who need to track exact VRM temperatures, identify precise memory timings, or log continuous thermal data during gaming sessions. Because its core monitoring features remain free for non-commercial use, it provides exceptional diagnostic detail for enthusiasts who want enterprise-grade telemetry without paying for an active stress-testing suite.
Common Issues and Fixes
- Application causes system freezes during polling. The software can occasionally conflict with specific motherboard sensors or older storage controllers during the initial hardware scan. Open the settings menu before clicking 'Run' and disable SMBus support or specific IDE/SATA drive polling under the Safety tab to prevent the hang.
- Shared memory overlays stop working after half a day. The free version limits the Shared Memory data feed to twelve hours of continuous operation. You must restart the application to reset the timer, or purchase a commercial license to keep the background data feed running permanently.
- Specific GPU or CPU temperatures are missing from the list. Some modern hardware components enter a deep sleep state to save power, which temporarily hides their sensors from the operating system. Put the system under a moderate workload, such as launching a game or a rendering task, to wake the hardware and populate the missing readouts.
- The interface is overwhelming and difficult to navigate. The default sensor list displays hundreds of data points, many of which are irrelevant to basic troubleshooting. Right-click any unnecessary row or entire category and select 'Hide' to clean up the layout, leaving only the exact metrics you actually need to monitor.
Version 8.40 — January 2026
- Introduced a built-in system Stress Test utility for stability checking.
- Added hardware detection for Intel Arrow Lake Refresh and Panther Lake processor SKUs.
- Implemented dedicated sensor monitoring for AMD and Qualcomm Neural Processing Units (NPUs).
- Included support for new AMD hardware, including Radeon AI PRO R9600D and R9700S GPUs, as well as updated Sarlak and Strix Halo compatibility.
- Separated integrated Intel GPU readings into their own distinct sensor category.
- Added DDR5 sensor recognition for LPCAMM2 memory modules and expanded SOCAMM2 data details.
- Enhanced sensor tracking on Colorful motherboards across the B650, B850, X870, Z790, and Z890 chipsets.
- Improved telemetry and overall support for Intel Nova Lake, including Nova Lake-H/HX variants.
- Expanded compatibility by adding AMD EXPO 1.20 support, Arctic Fan Controller integration, and non-JEDEC ID "Origin Code" detection.
- Added fan speed monitoring for the ASUS Vivobook Pro 15 N6506 and refined the identification process for Nuvoton super I/O sensors.
- Increased Event Tracing for Windows (ETW) buffer sizes to benefit PresentMon operations.
- Fixed a misreporting issue where disabled secondary NVIDIA graphics cards were incorrectly labeled as fake.
- Resolved an architectural detection bug regarding specific Intel Arrow Lake-S core configurations (4P+4E and 6P+12E).
- Fixed a UI glitch that occurred when navigating through search results in the main software window.